Disambiguation Step 4: Clustering Algorithms Evaluation
Evaluation is an important part of the development process of creating and understanding disambiguation algorithms. It allows users to assess the quality of the output and it allows the PatentsView team to gauge the value of proposed improvements to the algorithm.
However, this endeavor is challenging because no “gold standard” or “ground truth” dataset has all the properties one would like to properly evaluate the accuracy of the clusters (i.e., disambiguated groups of mentions). As an alternative, we used nine different manually labeled evaluation datasets with samples from the full set of patent data.[1]
We used two approaches for evaluating the results of the inventor, assignee, and location disambiguation algorithms. The first approach uses standard metrics found in the computer science literature (precision, recall, and F1) to determine the number of mentions correctly and incorrectly classified. The second approach uses a metric derived by the PatentsView team that focuses on the number of differently spelled names that were correctly and incorrectly assigned. This evaluation dataset was constructed to address cases that were difficult to disambiguate. All evaluation datasets described in this evaluation are publicly posted.[2]
[1] Because of the high number of records, it is not possible to code all the patent data manually.
[2] For data and results, see https://s3.amazonaws.com/disambiguation-eval/pv-eval-data.zip.
Evaluating the Quality of Disambiguation Algorithms
To evaluate the quality of the disambiguation algorithms, we created metrics to compare the predicted clusters produced by the algorithm against the actual clusters from our labeled evaluation datasets. An example is shown in Figure 5. Some records were correctly grouped together; “General Electric” and “General Electirc” both were predicted to be in cluster A together but others were not. “Motorola Electronics” is in cluster A instead of cluster B.
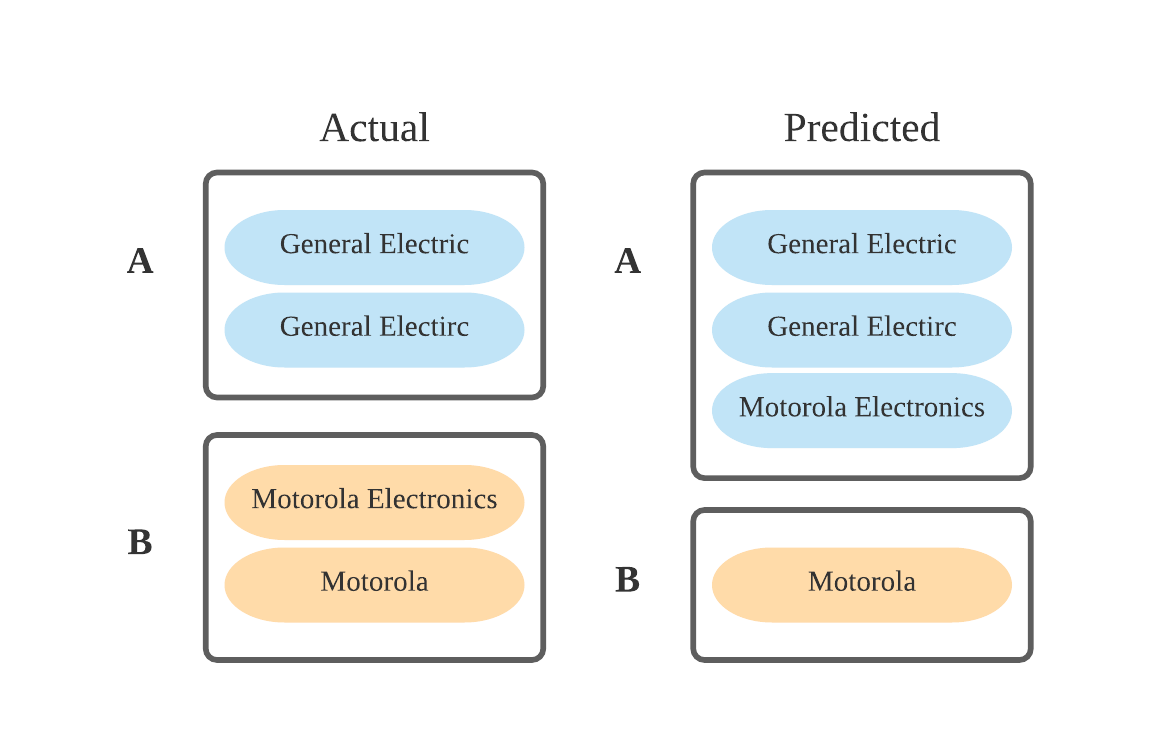
To quantify predictions, for each predicted cluster, we calculate the number of records that are correctly in the cluster (true positives), the number of records incorrectly included in the cluster (false positives), and the number of records incorrectly left out of the cluster (false negatives).
In Figure 5, cluster A has two true positives (“General Electric” and “General Electirc” are both correctly in cluster A), one false positive (“Motorola Electronics” is in cluster A and it should not be), and no false negatives (all records that should be in cluster A are in cluster A). For cluster B, we have one true positive (“Motorola” is correctly in cluster B), no false positives (there are no records in the cluster that should not be), and one false negative (“Motorola Electronics” should be in cluster B and is not).
Three metrics are used to score the balance among true positives, false positives, and false negatives: precision, recall, and pairwise F1 scores. These metrics, explained next, emphasize different aspects of correctness of the clusters that the algorithm creates.
Precision of the clustering algorithm measures what fraction of the mentions predicted to be in a cluster are supposed to be there (i.e., true positives). Mathematically, this is:
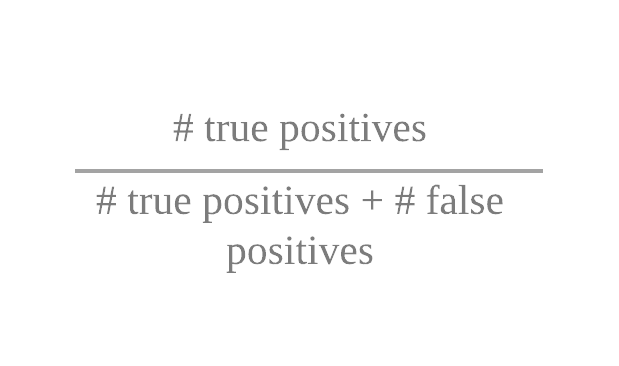
These metrics measure, intuitively, how precise the algorithm is, that is, how many records that we think belong together actually belong together.
Recall of the clustering algorithm measures what fraction of the records should have been in the cluster, and were predicted to be in that cluster. Mathematically, this is:
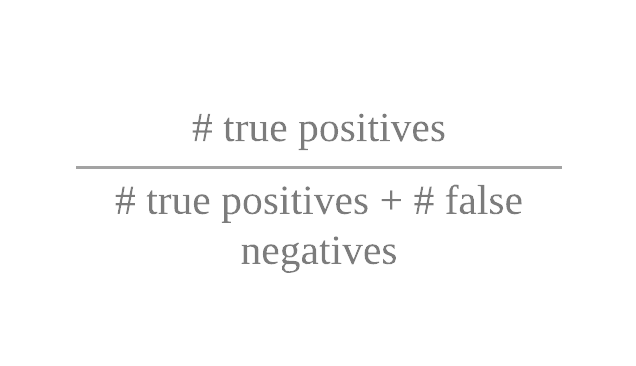
Recall has a natural trade-off against precision. If we want to be very careful to only put a record into a cluster if we are sure it belongs (i.e., to have a high precision), then we end up not putting some records into clusters where they actually belong (i.e., we will lower our recall). If we want to be really sure not to leave any record out of a cluster that it should be in (i.e., to have a high recall), then we will put some records into clusters where they do not actually belong (i.e., we will lower our precision). To balance precision against recall, it is common to use the F1 metric.
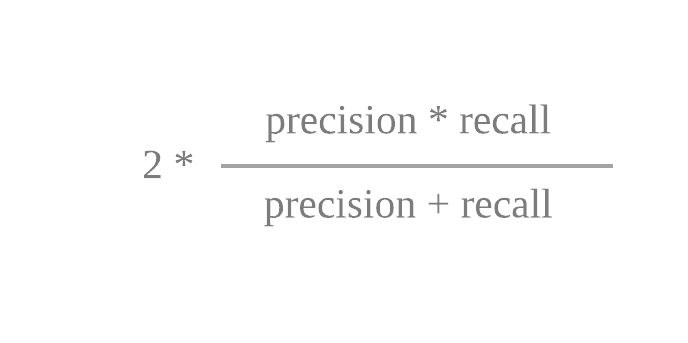
F1 Score of a clustering algorithm is the harmonic mean of precision and recall. Mathematically, this is:
Algorithm Evaluation Methodology
We took two key approaches for evaluating the disambiguation algorithms. The first approach evaluated the algorithm based on the standard precision, recall, and F1 metrics, essentially examining the number of mentions correctly and incorrectly classified (Table 1). This assessment shows how well the algorithms are performing (although the test cases were purposely selected to be more difficult to disambiguate than the average PatentsView mention).
Table 1. Evaluation Results That Compare the Precision, Recall, and F1 Scores for the Pairwise F1 Metric on PatentsView Disambiguation Methodologies
|
|
|
Evaluation Datasets |
|||
|
|
|
NBER Assignee |
PatentsView Assignee |
Location (Inventor) |
Location (Assignee) |
|
Disambiguation methodology for PatentsView data updated through 05/28/2018 |
Precision |
0.838 |
0.977 |
1.000 |
0.998 |
|
Recall |
0.971 |
0.977 |
1.000 |
0.975 |
|
|
F1 |
0.900 |
0.977 |
1.000 |
0.986 |
|
|
Disambiguation methodology for PatentsView data updated through 11/27/2018 |
Precision |
0.957 |
1.000 |
1.000 |
0.999 |
|
Recall |
0.928 |
0.981 |
0.980 |
0.990 |
|
|
F1 |
0.942 |
0.991 |
0.990 |
0.994 |
|
The second approach calculated the same metrics but focused on the number of distinct entity names instead of mentions. The core idea is that our algorithm could perform well using the overall metrics without being good at disambiguating. For example, say we have 300 mentions of “Green Farms Corn Technologies,” one mention of “Greens Farms Corn Technologies” and two mentions of “Green Farms Corn Technology.” If our algorithm correctly clustered the 300 “Green Farms Corn Technologies” together but excluded the other three mentions, it would have a very high recall (300/300+3 = 0.99). However, the algorithm would not have succeeded in clustering any of the entities with differently spelled names.
To measure this aspect of disambiguation performance, we examined specifically what we call Name Variation evaluation metrics. Of the set of different spellings of a name, this metric measures how many of the name variants were included in the predicted clusters. In the example in the previous paragraph, our recall would now be much lower because we correctly identified one name (one true positive) and falsely excluded two names (two false negatives) for a recall of 1/3 = 0.3333. The results for this more challenging metric are shown in Table 2.
Table 2. Evaluation Results Comparing the Average, True Positives, False Positives, False Negatives, and F1 Scores for the Name Variation Evaluation Metric on PatentsView Disambiguation Methodologies
|
|
|
Evaluation Datasets |
|||
|
|
|
NBER Assignee |
PatentsView Assignee |
Location (Inventor) |
Location (Assignee) |
|
Disambiguation methodology for PatentsView data updated through 05/28/2018 |
Average |
2.49 ± 15.25 |
41.73 ± 84.89 |
0.65 ± 0.56 |
1.94 ± 2.70 |
|
True positive (TP) |
7,305 |
2,036 |
26 |
229 |
|
|
False positive (FP) |
10,155 |
2,682 |
0 |
18 |
|
|
False negative (FN) |
7,841 |
1,951 |
32 |
197 |
|
|
F1 |
0.448 |
0.468 |
0.619 |
0.681 |
|
|
Disambiguation methodology for PatentsView data updated through 11/27/2018 |
Average |
1.90 ± 7.02 |
31.14 ± 54.29 |
0.69 ± 0.54 |
0.78 ± 1.30 |
|
True positive (TP) |
6,716 |
2,207 |
25 |
352 |
|
|
False positive (FP) |
5,312 |
1,676 |
1 |
13 |
|
|
False negative (FN) |
8,430 |
1,780 |
33 |
74 |
|
|
F1 |
0.494 |
0.561 |
0.595 |
0.890 |
|