Thursday, March 17, 2022 - 13:42
Releasing Annualized Data Files for Patents, Assignees, and Inventor Gender
We are pleased to release annual datasets for exploring patents and their inventors and companies. The annual datasets are in csv files small enough for users without data science or coding knowledge to manipulate and view information about the inventors and company(ies) associated with every granted patent, including the gender of inventors generated by our gender attribution algorithm. These annual datasets are constructed around patent grant year, and combine corresponding company (assignee) and inventor information for each patent granted between 1976 to 2020. We constructed these datasets to improve user access to PatentsView data, especially those users interested in women inventors.
So, what’s in the new dataset?
To create the annualized data, we combined the following list of datasets available from the bulk download page for granted patents. We did not utilize all the fields from each, but selected fields to generate these smaller files. A data dictionary of all the variables within the annualized datasets is available with the downloads for more information on what fields they contain.
- rawinventor: includes information on the unique id associated with each patent and inventor.
- inventor: includes information on the unique first and last name of each inventor, a flag to indicate gender of each inventor, and the inventor id from the rawinventor dataset.
- patent: includes information about the patent grant date.
- patent_assignee: is a cross-walk that gives the unique assignee id associated with each patent.
- assignee: identifies the unique location id for each assignee and the unique assignee name.
- location: contains information about the country, city and state, and county of the assignee if within the U.S.
- application: links the application id to the granted patent id, and gives the application year.
- ipcr: includes information on the ipc/cpc section (technology field) of the granted patent.
A couple notes on using the new dataset:
- As you become acquainted with the data, you may notice that there are only nine fields provided for the first nine inventors listed for each patent. Of course, some patents have more than 9 inventors. The maximum number of inventors for a patent recorded within the PatentsView dataset is 123 inventors. However, 99% of patents have nine inventors or less. To make the datasets more user-friendly, we truncated the data to only include the first nine inventors. If you are interested in acquiring the names and gender information of these very large inventor teams, please refer to the original bulk data.
- Some patents appear more than once because they are granted to more than one company. We did this to make it easier for an individual to, for example, search for all patents and inventor genders associated with a certain company.
Applications
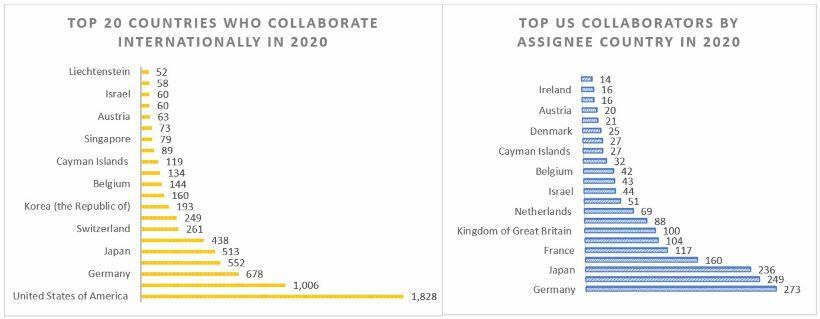
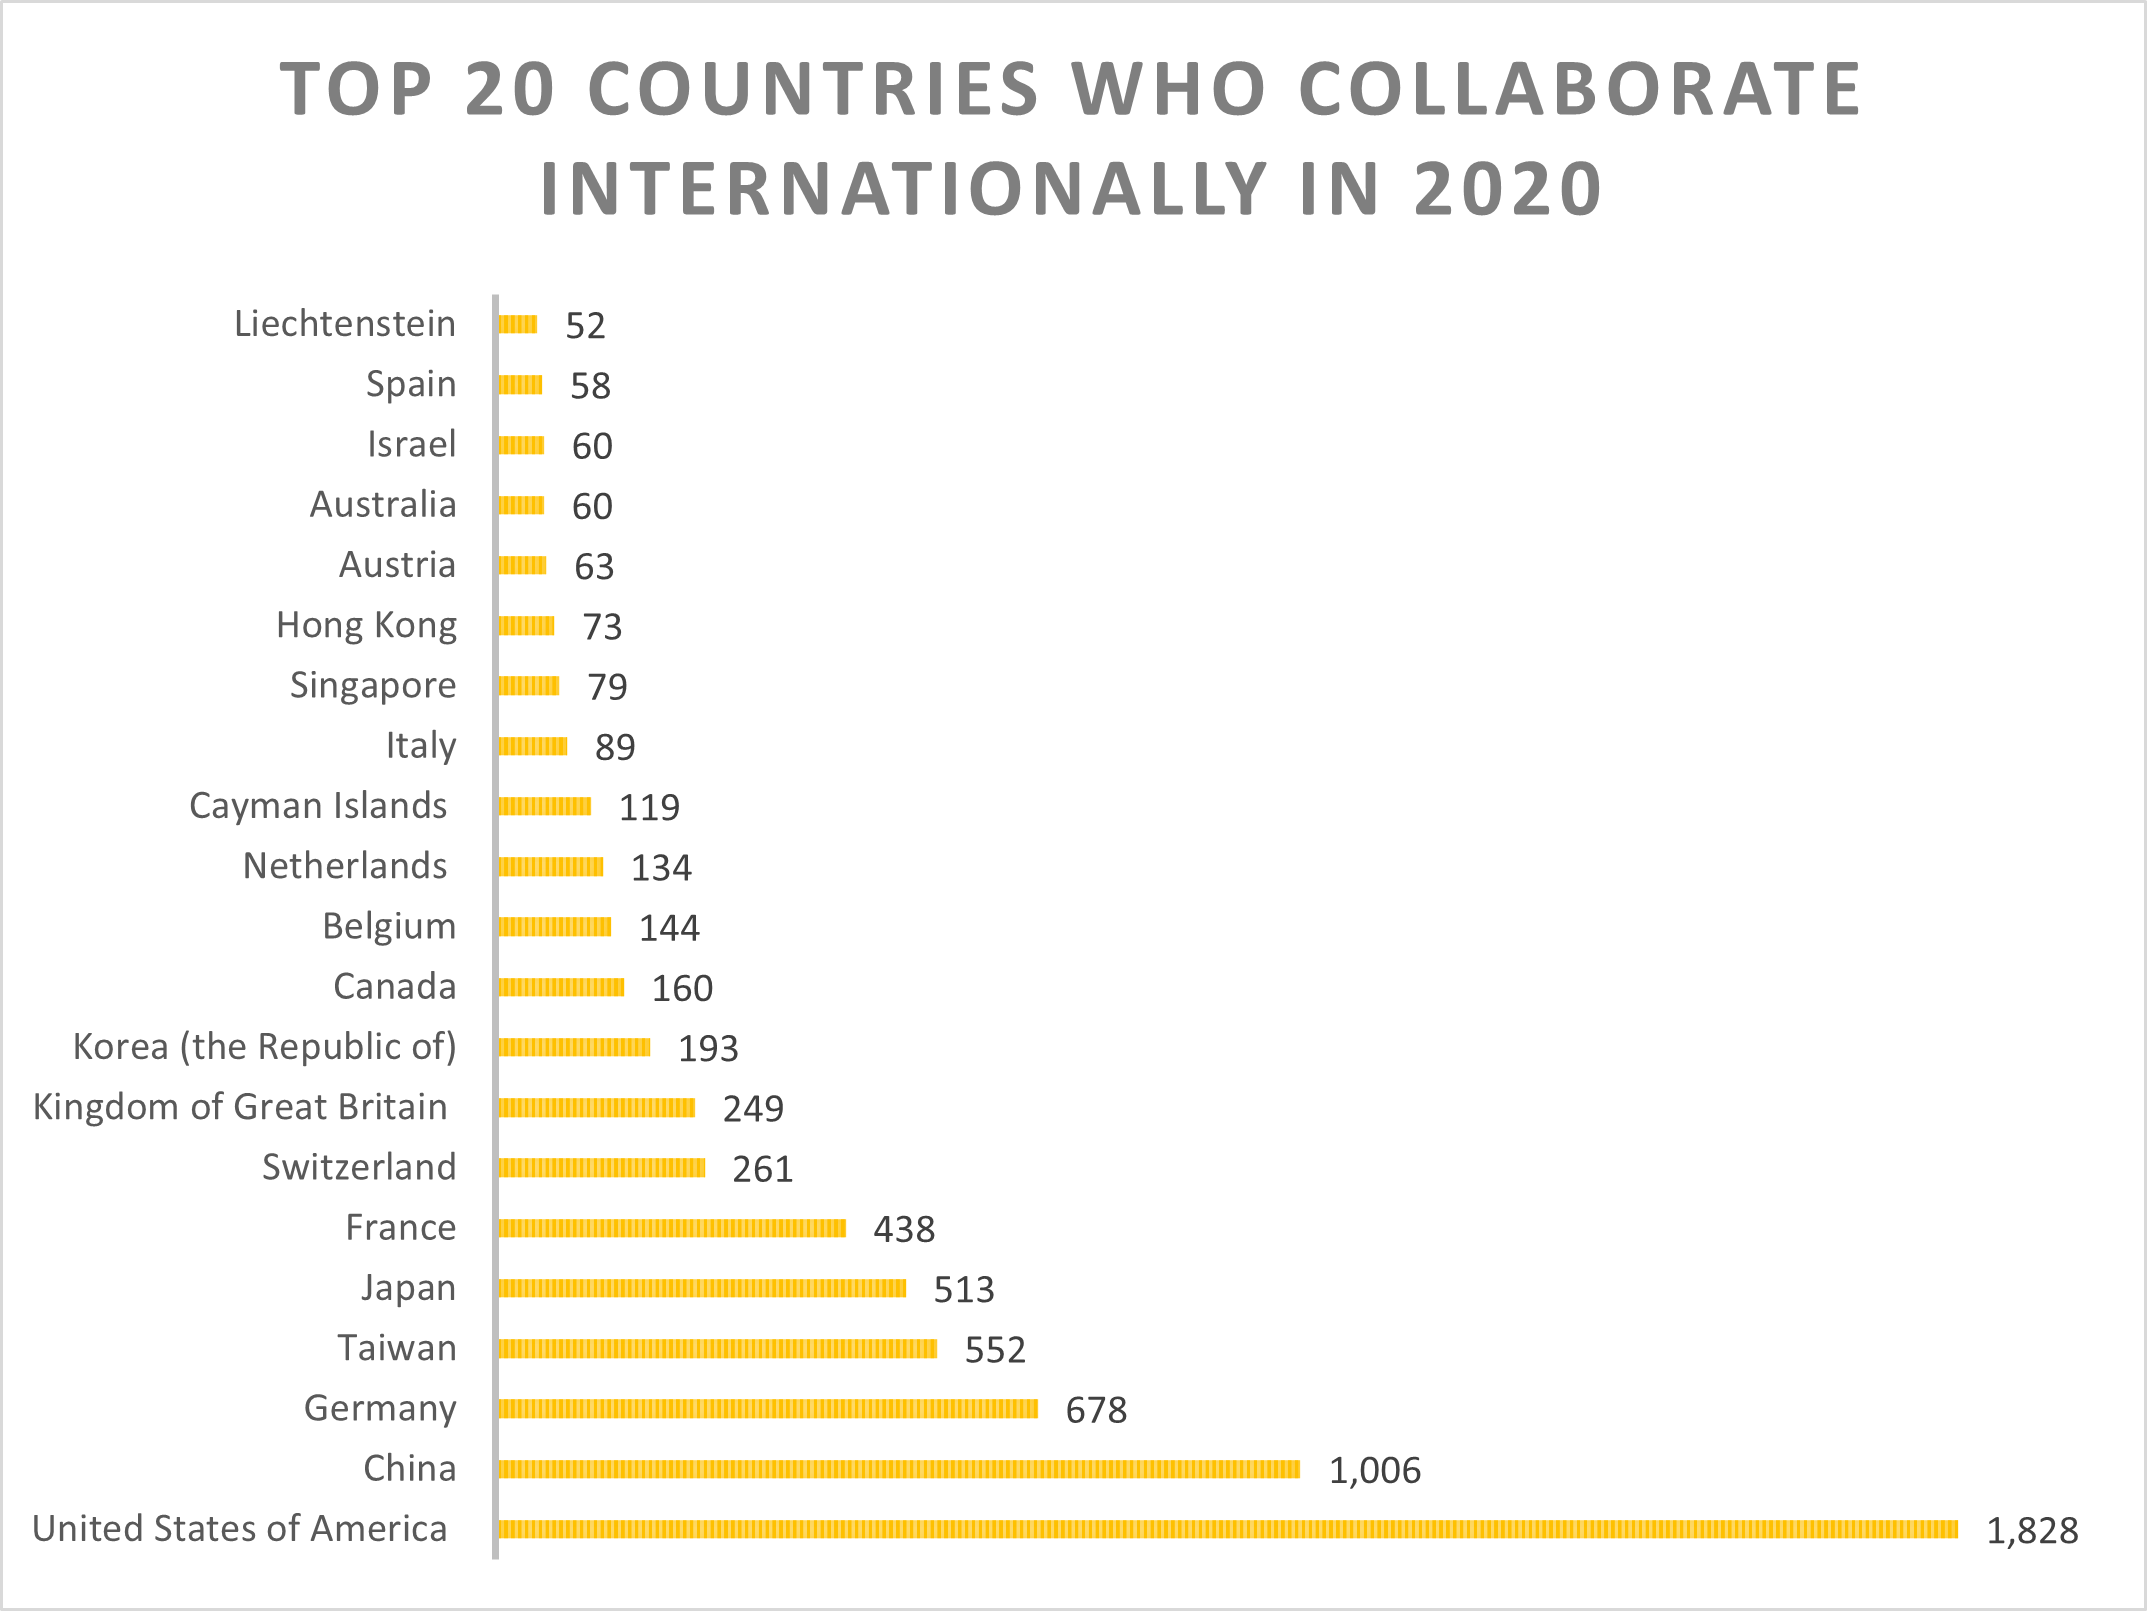
We used the annualized data to generate the following graphs and to illustrate some of the potential uses for this release. In figure 1, we tally the number of patents for each country that have companies/assignees from different countries to define the international collaboration that occurred in 2020. The United States had the most international collaborations in 2020 with 1,828 patents. Behind the U.S., China and Germany were found to have the second- and third-most international collaborations.
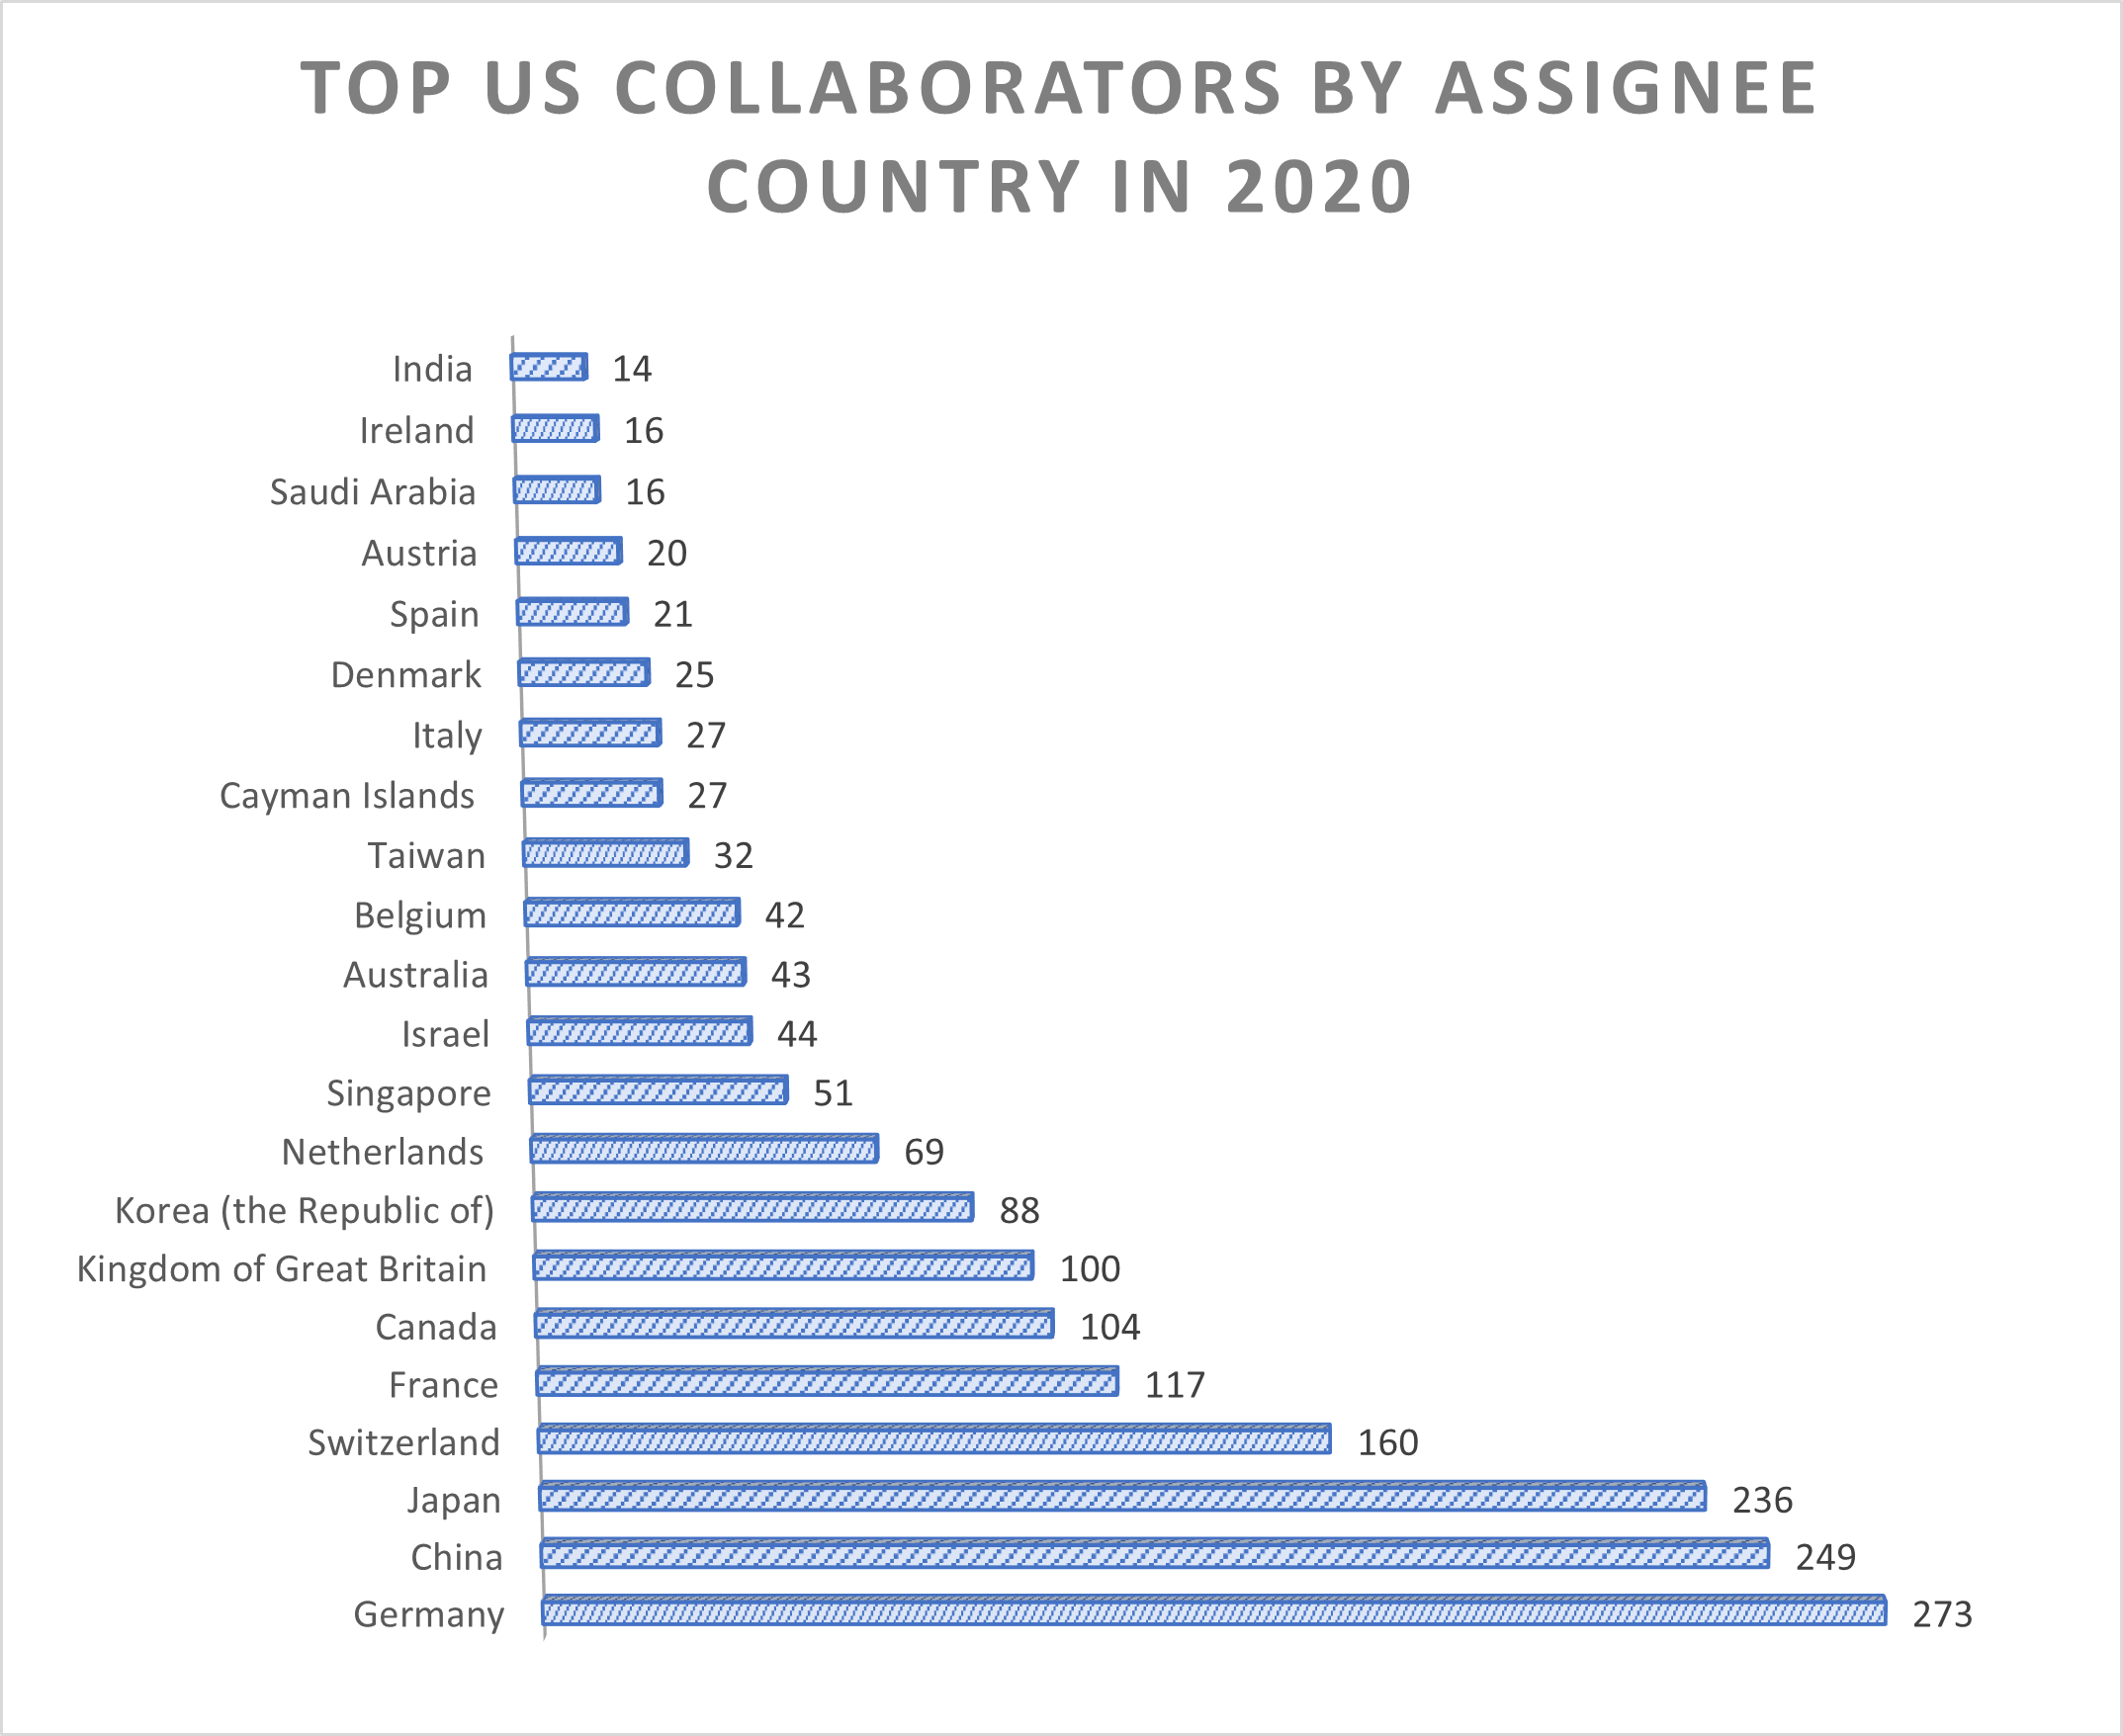
Among the 1,828 U.S.-international collaborations, we see from the next figure (Figure 2) that 273 of them were collaborations with companies in Germany, the most frequent international collaborator of the U.S. China and Japan are not far behind with 249 and 236 collaborations, respectively, in 2020.
Last, we calculate and rank the women’s inventor rate (WIR) by country of assignee. The following graph (Figure 3) shows the countries in the top-25th percentile in terms of the number of granted patents in 2020. As you can see, Taiwan is firmly in first place with 32.2% of inventors identified as women in 2020. In second place is Spain with 22.6%, followed by France with 17.1%. The U.S. is just above the middle of the pack at 13.1%, with several European and Asian countries ahead of them.
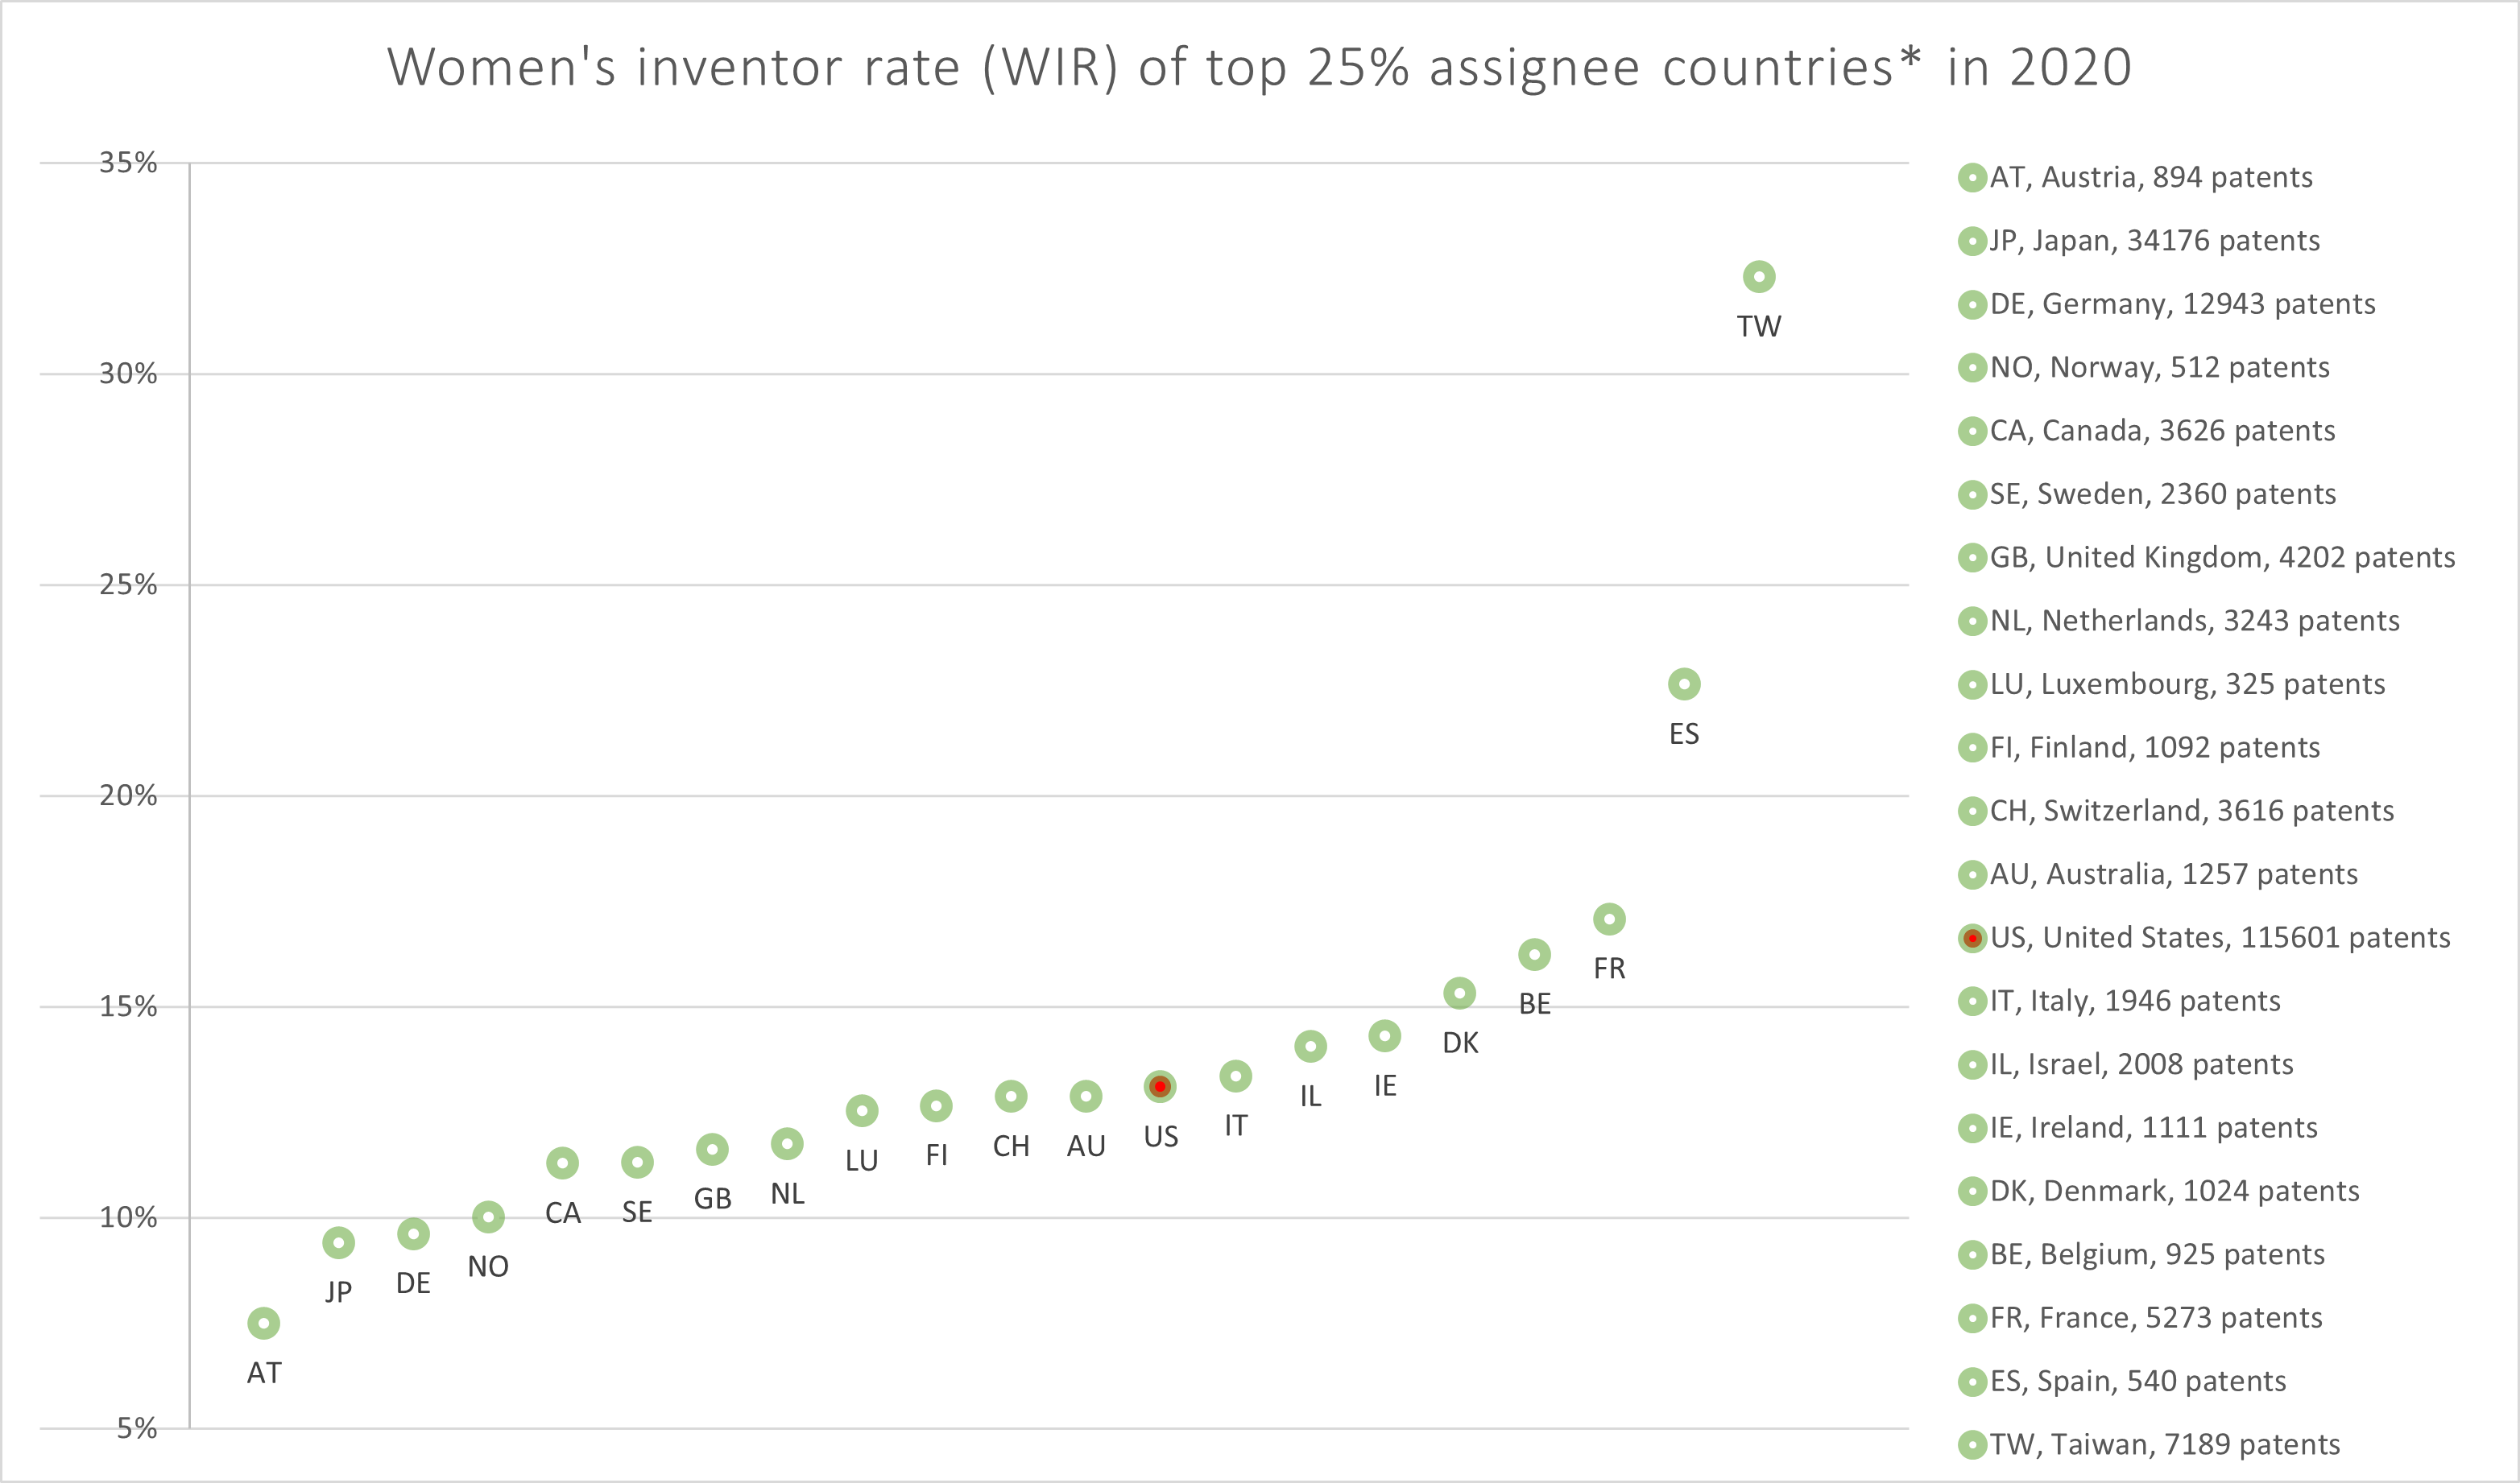
*Note: Some names are more difficult to attribute with gender than others. There is particular difficulty in attributing gender to Asian names. For these reasons we have eliminated countries with an attribution rate of less than 90% as the WIR is deemed less reliable. Specifically, this eliminates China, The Cayman Islands, South Korea, India, Hong Kong, Singapore and Saudi Arabia from this graph. This information is available in the annual datasets.