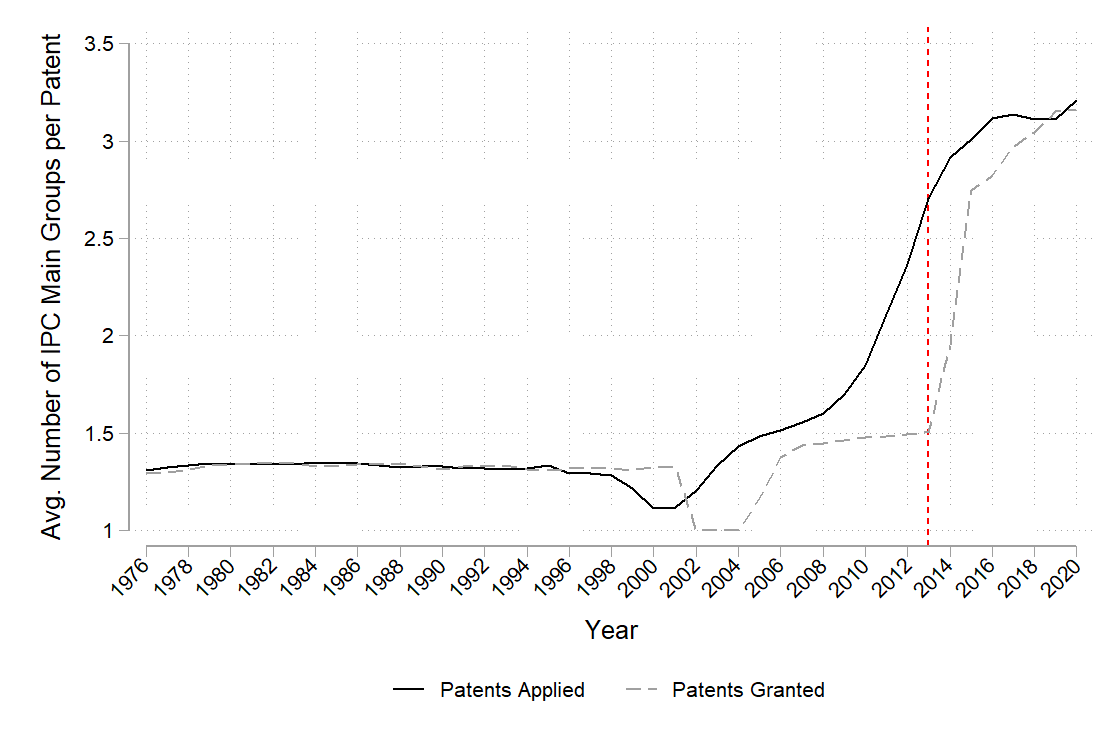
Discontinuity of the Number of IPC Technology Main Groups per Patent in 2013
Dear PatentsView team,
I'm using information on IPC technology main group contained in the ipcr.tsv file to trace the dynamics of the number of IPC main groups assigned to patents (See figure below). I notice a dramatic change in 2013 as the average number of IPC main groups per patent takes off around that period. Does anyone know what may be driving this discontinuity? Is there major change in patent examination practice around that period of time?
I know the CPC scheme was first introduced and used by the USPTO in 2013. Does this relate to it? If so, how?
Thank you very much!

