 
 
 
IN THIS SECTION
ex. data visualization, research paper
  • New Report from USPTO Highlights COVID-Related Patents

    COVID-19 disrupted all our lives, but it also opened the door to innovation. The speed at which researchers, companies, and universities developed new tests, treatments, and vaccines was unprecedented. A new report from the U.S. Patent and Trademark Office (USPTO) Office of the Chief Economist found that much of the innovation around diagnosing COVID-19 was led by universities and small companies.

    Diagnosing COVID-19: A perspective from U.S. patenting activity looks at patents filed that relate to diagnosing the COVID-19 as it emerged and spread. It contributes to a growing body of research that examines how innovation responds to crisis. The report was released on October 23.

    The research team used PatentsView to identify patents that include a government interest statement. This helped them to identify which patents were funded by government agencies.

    Key Findings from the Report

    The report looked at patents filed or issued through April 2023 that helped identify and detect the SARS-CoV-2 virus. Some of the key findings in the report included:

    • The number of COVID-19 diagnostic patent filings that were published by the USPTO surged and then receded in the months following the emergence of the coronavirus—such publications peaked in the fourth quarter of 2021, which generally reflects applications filed in April, May, and June of 2020.

    • COVID-19 diagnostic filings make up about 30% of all COVID-19 public patent filings, hovering at about one out of every three COVID-19 filings at the USPTO.

    • Small companies and universities led the way in COVID-19 diagnostic public patent filings at the USPTO with the top filer being a diagnostic startup company.

    • U.S. government financial support helped spur COVID-19 diagnostic inventions, as indicated by government interest statements contained in the filings. About 10.7% of all COVID-19 public patent filings show government support, with the National Institutes of Health leading other agencies.

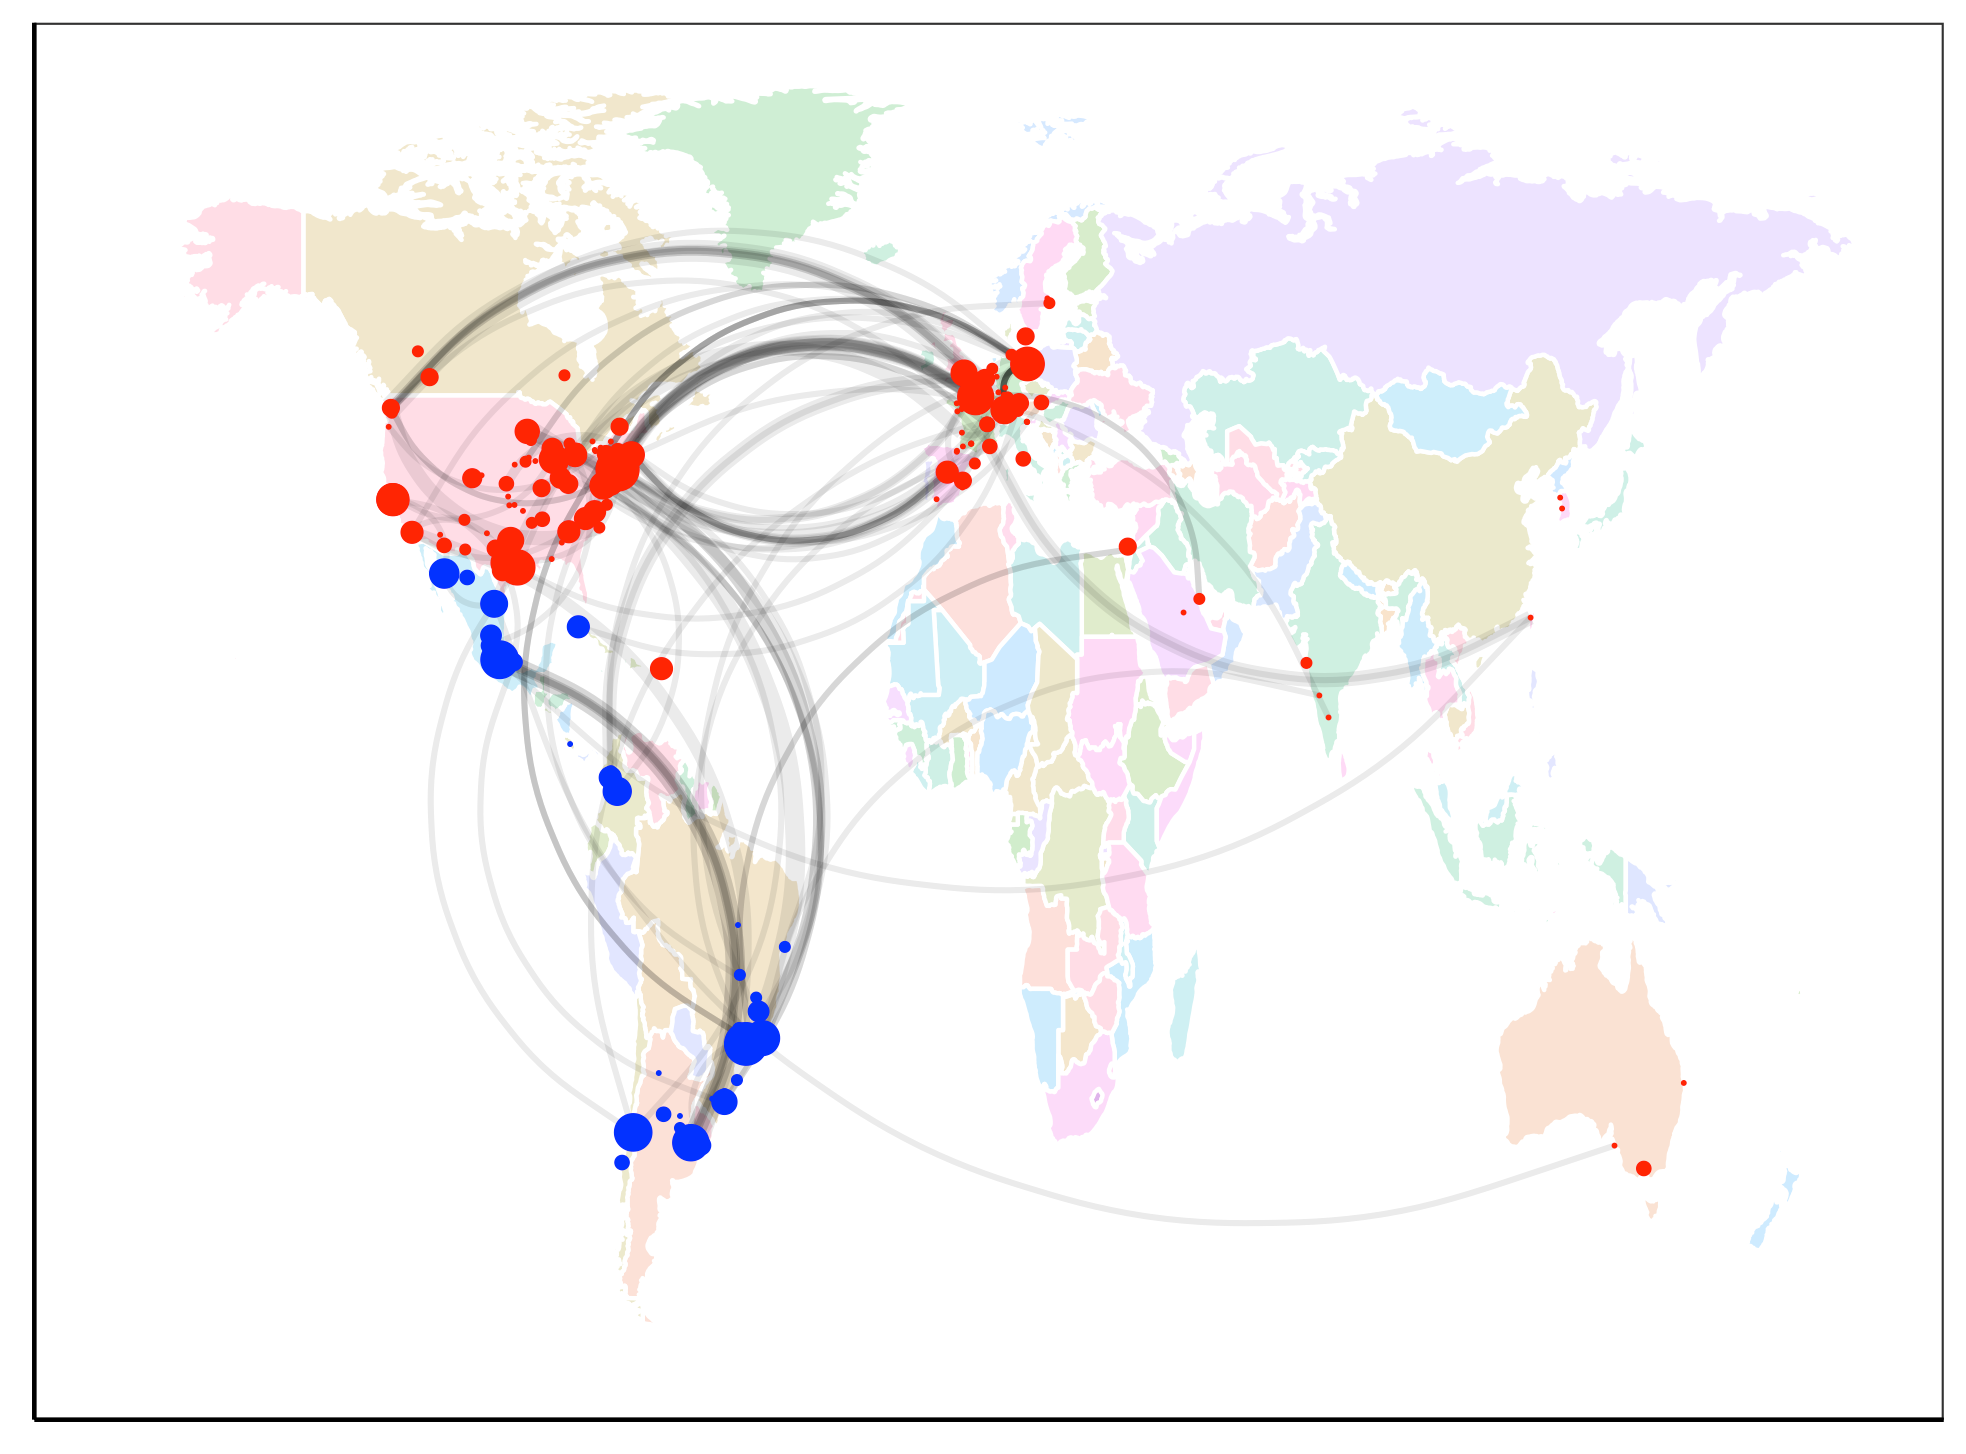
    • U.S.-based applicants are leading those from other countries in U.S. COVID-19 diagnostic public patent filings, making up most of the volume, including most of the top 21 applicants.

    • COVID-19 diagnostic public patent filings are concentrated in a few technologies such as analyzing materials and measuring enzymes, nucleic acids, and microorganisms.

    • Many applications for inventions directed at COVID-19 diagnostics also disclose methods of treatment (about 8.6%). For instance, inventions for antibodies may diagnose and treat COVID-19.

    • Among 5,585 global COVID-19 diagnostic patent families found in the study, 47% have at least one filing at the China National Intellectual Property Administration (CNIPA), the most of any jurisdiction.

    Read the Full Report

    The full report is available on the USPTO website.

  • Using PatentsView for academic research in underdeveloped regions

    by Pablo Galaso and Sergio Palomeque

    Patent data have been extensively used in academic research in several knowledge areas. This kind of data is particularly useful for studying knowledge flows and factors affecting innovation. In this sense, detailed information on inventions registered by patents and the possibility of studying the interactions between agents are among their main advantages.

    In Latin America, academic research using this type of data is limited compared to other parts of the world, due to the absence of an international office that allows comparability between countries by unifying the patent regulatory framework. In addition, historically, patent offices worldwide have ensured the identification of each registration but, for various reasons, not unique identifiers to the actors involved.

    PatentsView Helps Fill in Gaps in Patents Data for Researchers

    To address these difficulties, researchers at the Institute of Economics of the UdelaR have used the data provided by PatentsView to carry out academic research since 2017. This research contributes to understanding the characteristics and limitations of innovation systems in Latin America, at regional, national and subnational levels (https://spwebfcea.wixsite.com/inventioninla).

    The relevance of obtaining intellectual property protection in the United States for frontier innovations makes the USPTO records useful for analysing innovation processes in different regions of the world, particularly in Latin America, where there is no international agency. The use of USPTO data allows an adequate comparison of inventive activities between countries, avoiding problems associated with the institutional differences among national patent offices.

    On the other hand, the process of systematising information and disambiguating actors carried out by PatentsView allows the use of patent data on a much larger scale than in the past.

    In-depth Learning and Applications

    To support and disseminate the use of this data, we have conducted a series of activities, including:

    A webinar that sought to:

    • Introduce participants to the advantages of using USPTO patent data for research on collaboration networks in cities and regions of developing countries, especially in Latin America. The webinar presented the main features of this data source, the advantages of accessing it through the PatentsView platform and some examples of research articles using this data.

    A workshop where:

    • The participants learned more in-depth about the applications and methods that use this data and practiced how to use R for processing and analysis of collaboration networks.

    These activities were carried out within the Regional Studies Association Research Network on Knowledge, Innovation and Regional Development in South America (KIRDSA).

    Further Reading

    Below is a list of papers we have published in this line of research, which may provide a better idea of the possibilities for Latin America and other world regions.

    • Bianchi, C., Galaso, P., & Palomeque, S. (forthcoming). Absorptive capacities and external openness in underdeveloped Innovation Systems: A patent network analysis for Latin American countries 1970-2017. Cambridge Journal of Economics. https://doi.org/https://doi.org/10.1093/cje/bead034
    • Bianchi, C., Galaso, P., & Palomeque, S. (2023). Knowledge complexity and brokerage in inter-city networks. The Journal of Technology Transfer. https://doi.org/10.1007/s10961-023-10025-x
    • Bianchi, C., Galaso, P., & Palomeque, S. (2023). The trade-offs of brokerage in inter-city innovation networks. Regional Studies, 57(2), 225–238. https://doi.org/10.1080/00343404.2021.1973664
    • Bianchi, C., Galaso, P., & Palomeque, S. (2021). Patent Collaboration Networks in Latin America: Extra-regional Orientation and Core-Periphery Structure. Journal of Scientometric Research, 10(1s), s59–s70. https://doi.org/10.5530/jscires.10.1s.22
    • Bianchi, C., Galaso, P., & Palomeque, S. (2020). Invention and Collaboration Networks in Latin America: Evidence from Patent Data (DT 04/2020). Serie Documentos de Trabajo. Montevideo.

    Inter-city collaboration network in Latin America

    A map showing the inter-city collaboration network in Latin America
    Source: authors based on PatentsView data
  • Exploring Trends in Gender and Patents

    PatentsView was created to help researchers, policymakers, and anyone with an interest in patents and innovation better find, visualize, and analyze patents data in the United States. One key question people have been asking us is how inventors match up against the gender distribution in the US. This question is so important because we know that if certain groups are not participating in the advancement of innovation and technology, that drags down the overall potential for improving health, happiness, and economic growth.

    Unfortunately, data on demographics like race/ethnicity, gender, and more are not collected in patent data. All is not lost though, and the PatentsView team has been working to develop and refine disambiguation methods to yield insights into these attributes.  With these disambiguation methods, we’re able to get a clearer picture of how the makeup of inventors has changed over time.

    This disambiguated data has been particularly helpful in understanding trends in gender and innovation over time. These data visualizations show some interesting patterns.

    Men Have Dominated Innovation for Decades

    A pie graph showing that more than two-thirds of inventors since 1976 were men, titled "Inventor Gender - Total All Time"
    Data visualization by Emma Stefanovich. Click to see full size image.

    Based on PatentsView data, which contains information about patent applications going back to 1976, inventors have been much more likely to be male that female for decades.

    In fact, more than two-thirds (78.8%) of inventors from 1976 to 2023 have been male. Of the remainder, 12.8% were determined to be female, and 8.4% were unidentified, meaning the algorithms could not reliably predict their gender.

    More women are applying for patents

    However, the good news is that we appear to be trending toward more diversity in innovation. This accompanying graph shows that the percentage of women inventors has grown over time since 1976. So far this year, male inventors make up 64.7% of all inventors. Last year, they made up 65.1% of all inventors. In 1976, they made up 94.1% of all inventors.

    A bar graph showing that the percentage of inventors identified as women is growing over time.
    Data visualization by Emma Stefanovich. Click to see full size image.


    This trend is especially positive because it does not show a decrease in participation overall. In fact, the number of inventors of all genders has steadily increased over time, as shown in the graph below. Women and unidentified inventors have simply grown at a faster rate.

    A line graph showing the total number of inventors has grown at the same time that the percentage who were identified as women was growing.
    Data visualization by Emma Stefanovich. Click to see full size image.

    Room to grow

    While these trends show positive growth in the gender diversity of inventors, the numbers are still heavily skewed male. Over the last year, men still made up the majority of inventors. Luckily, PatentsView can help policymakers and researchers explore these trends, and eventually find ways to ensure everyone can reach their full innovative potential.

    This graph shows the total number of inventors who filed for patents over the last year, broken down by gender. The ratio of male to female inventors has remained stable through the year, with men still being the majority.

    A line graph showing that the number of inventors and the percentage of male, female, and unidentified inventors has remained stable over the last year.
    Data visualization by Emma Stefanovich. Click to see full size image.

    Explore more PatentsView data

    PatentsView can help you discover relationships behind different patents, locations where patents have been granted, and other trends in innovation. Explore the data for yourself or visit our service desk to request an API key, provide feedback, and more.

  • How Can We Apply Skill Relatedness Networks to Innovation?

    By Siddharth Engineer

    A skill relatedness network is an interconnected system which shows similarities between industries.

    Imagine there are many employees who transition from industry A to industry B. This would suggest that the two industries require similar skillsets. A skill-relatedness network provides a broad view of such labor flows to better understand the similarities between fields.

    This can be valuable information to economists, firms seeking to leverage human capital, and people seeking employment opportunities. Let us look at one example a little bit more closely. Labor mobility, referring to a worker’s ability to move between jobs and industries, is critical in the personal/financial growth of workers. This can lead to reductions in poverty and an overall stronger economy.

    Transportation Limits Worker Mobility in Columbia

    In Colombia, an analysis of transportation systems revealed that commute times were significantly limiting the ability of firms to make use of a diverse pool of skills.

    When employers in similar industries are grouped geographically, this limits labor mobility because workers with limited transportation options cannot move between industries. Instead, we can map skill-relatedness networks to geographic regions to capture the employment opportunities that sector classifications would otherwise overlook (O’Clery et al. 2019).

    Below: an example skill relatedness network for labor markets

    Visualisation of the skill-relatedness network for Colombia, where nodes correspond to industries and edges correspond to positive values of the adjacency matrix given in Eq. 2. The node size is proportional to industry complexity, and colours correspond to the sector groups given in the legend

    Looking at Skill Relatedness Networks Differently

    More recently, we have been able to apply skill-relatedness networks to innovation. Let us adapt our prior definition of skill-relatedness. Instead of focusing on employees who change work, let us look at inventors who change fields. At the end of the day, both employment and patents are applications of an individual’s skill. By identifying inventors with patents in multiple fields, we can get a better picture of the human capital available for innovation specifically.

    Using PatentsView's disambiguated inventor data, we can mathematically define this new skill-relatedness network. Imagine transition matrices (F) between technologies of dimensions N x N where N represents the total number of technologies. Each element Fi,j = 1 if an inventor transitioned from technology i to technology j.

    A Case Study

    Sergio Palomeque constructed a skill-relatedness network by aggregating these matrices, comparing it to a null model, and normalizing the data. The results revealed that the diameter of the network has decreased over time, particularly in the last 10 years.

    A decreasing diameter indicates more links between existing technologies than new ones are being introduced. While the reasons for this trend are still unclear, further research in skill-related networks could offer valuable insights into innovation, as demonstrated in the context of transportation in Colombia.

  • What's New with PatentsView - June 2023

    June Updates 

    This month in PatentsView news, the data team will release quarter four data for 2022 and the quarter one data for 2023. The disambiguated and processed data will include patents and published pre-grant patent applications from September 30, 2022, to March 30, 2023. In addition to bulk downloadable data for granted patents and pre-grant application publications, the legacy MySQL API, Elasticsearch beta API, and site visualizations will also be updated with data through March 30, 2023. To celebrate the completion of processing for the year 2022, we're lighting sparklers just in time for the independence and Emancipation Day celebrations in the United States!

    In our previous data updates, PatentsView gender data was attributed through a partnership with faculty at the University of Bordeaux. Starting from the final quarter of 2022 up to the present, our PatentsView data scientists have attributed gender to inventors using World Intellectual Property’s (WIPO’s) Genderit Method algorithm, which has been adjusted by our team. The new attribution method has been applied to all historic records and assigned to disambiguated inventors based on the majority gender of raw inventor records that combine to make the disambiguated inventor. For instance, if over 50% of raw records for a given inventor are marked female, then the inventor is attributed as female. In cases where exactly 50% of raw inventor records are marked as both female and male (which did occur), the gender remains unattributed.

    PatentsView has brought the inventor gender algorithm in house starting with the next data release. We aim to simplify processes and improve the timeliness of the data releases while maintaining data quality. Our new method outperforms the old method in terms of attribution rate based on a comparison of a sample week of quarter of data by 4%. In summary, the inclusion of gender attribution in the PatentsView internal data pipeline will ultimately result in faster and more accurate gender information for researchers, economists, students, inventors, and other users.

    Looking Ahead

    In pursuit of a faster and more efficient data processing pipeline that does not deter the current quality of PatentsView data, the data team also invested in weekly parsing of the raw XML data files from the United States Patent and Trademark Office (USPTO). Incremental conversion of the XML data into tsv format allows the data team to catch errors in the process before they lead to data quality issues or impede the disambiguation and attribution data processes further along the pipeline.

    Here's to diving into 2022 annual data and beginning our exploration with 2023!

Button sidebar