
PatentsView was created to help researchers, policymakers, and anyone with an interest in patents and innovation better find, visualize, and analyze patents data in the United States. One key question people have been asking us is how inventors match up against the gender distribution in the US. This question is so important because we know that if certain groups are not participating in the advancement of innovation and technology, that drags down the overall potential for improving health, happiness, and economic growth.
Unfortunately, data on demographics like race/ethnicity, gender, and more are not collected in patent data. All is not lost though, and the PatentsView team has been working to develop and refine disambiguation methods to yield insights into these attributes. With these disambiguation methods, we’re able to get a clearer picture of how the makeup of inventors has changed over time.
This disambiguated data has been particularly helpful in understanding trends in gender and innovation over time. These data visualizations show some interesting patterns.
Men Have Dominated Innovation for Decades
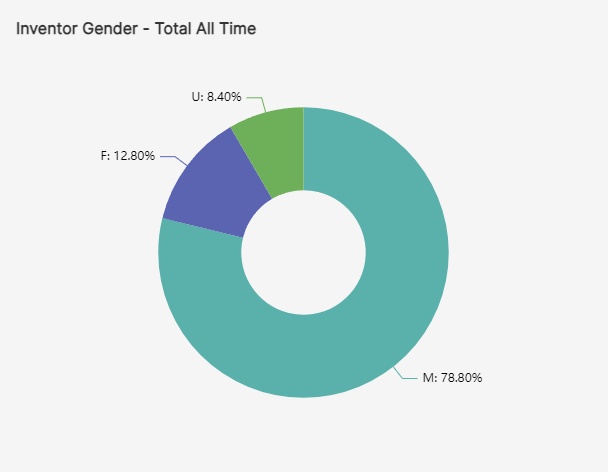
Based on PatentsView data, which contains information about patent applications going back to 1976, inventors have been much more likely to be male that female for decades.
In fact, more than two-thirds (78.8%) of inventors from 1976 to 2023 have been male. Of the remainder, 12.8% were determined to be female, and 8.4% were unidentified, meaning the algorithms could not reliably predict their gender.
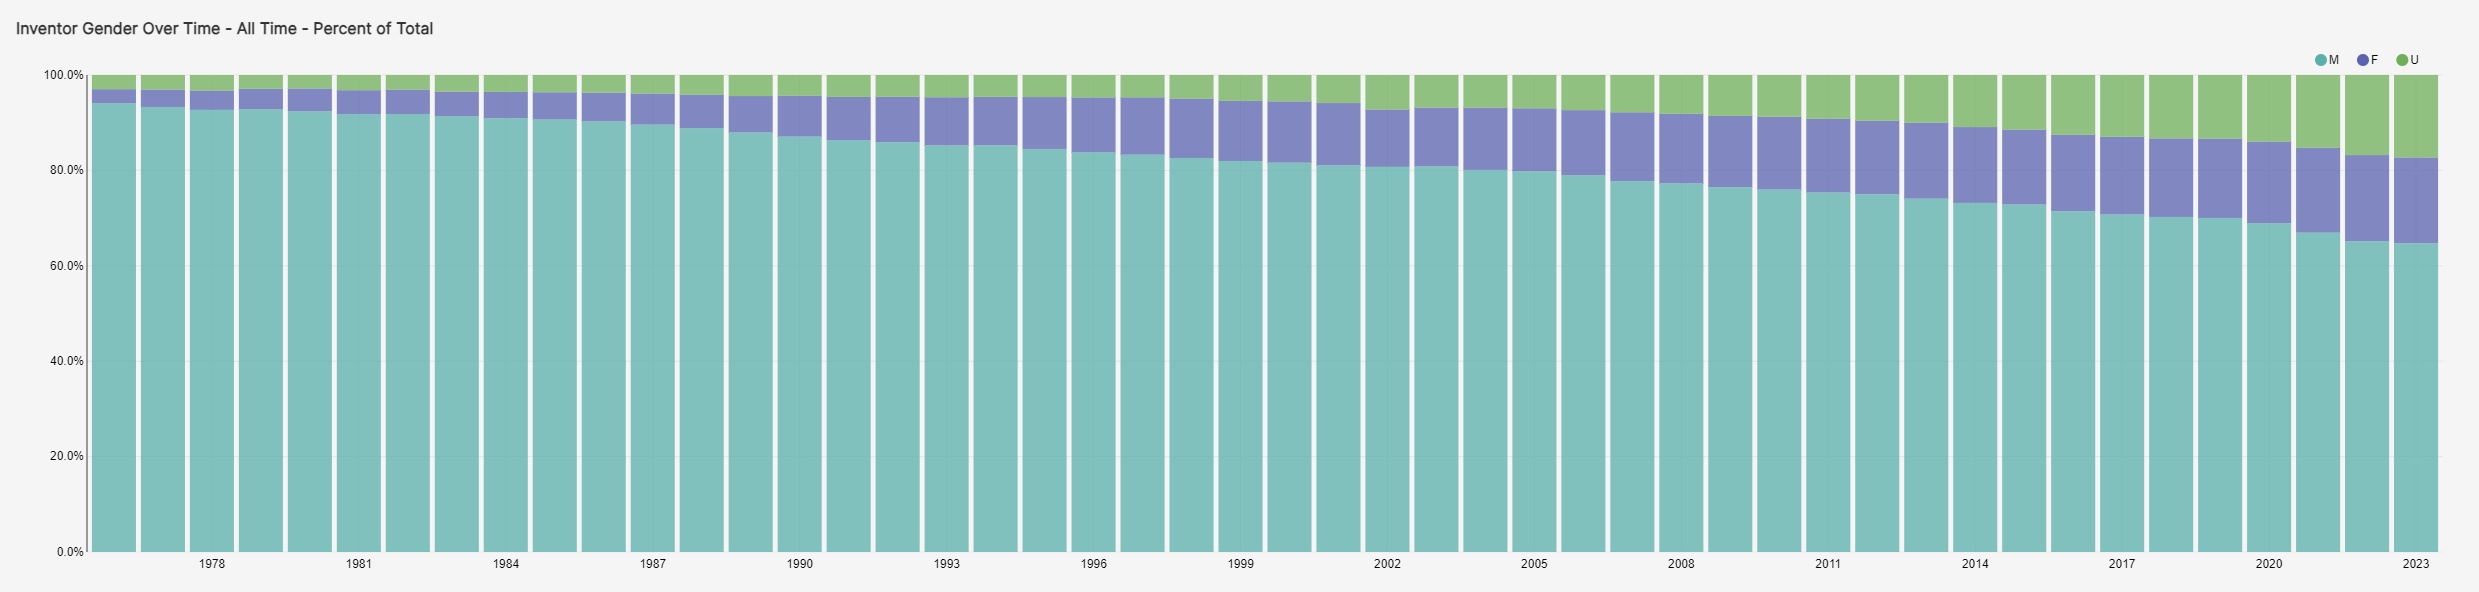
More women are applying for patents
However, the good news is that we appear to be trending toward more diversity in innovation. This accompanying graph shows that the percentage of women inventors has grown over time since 1976. So far this year, male inventors make up 64.7% of all inventors. Last year, they made up 65.1% of all inventors. In 1976, they made up 94.1% of all inventors.
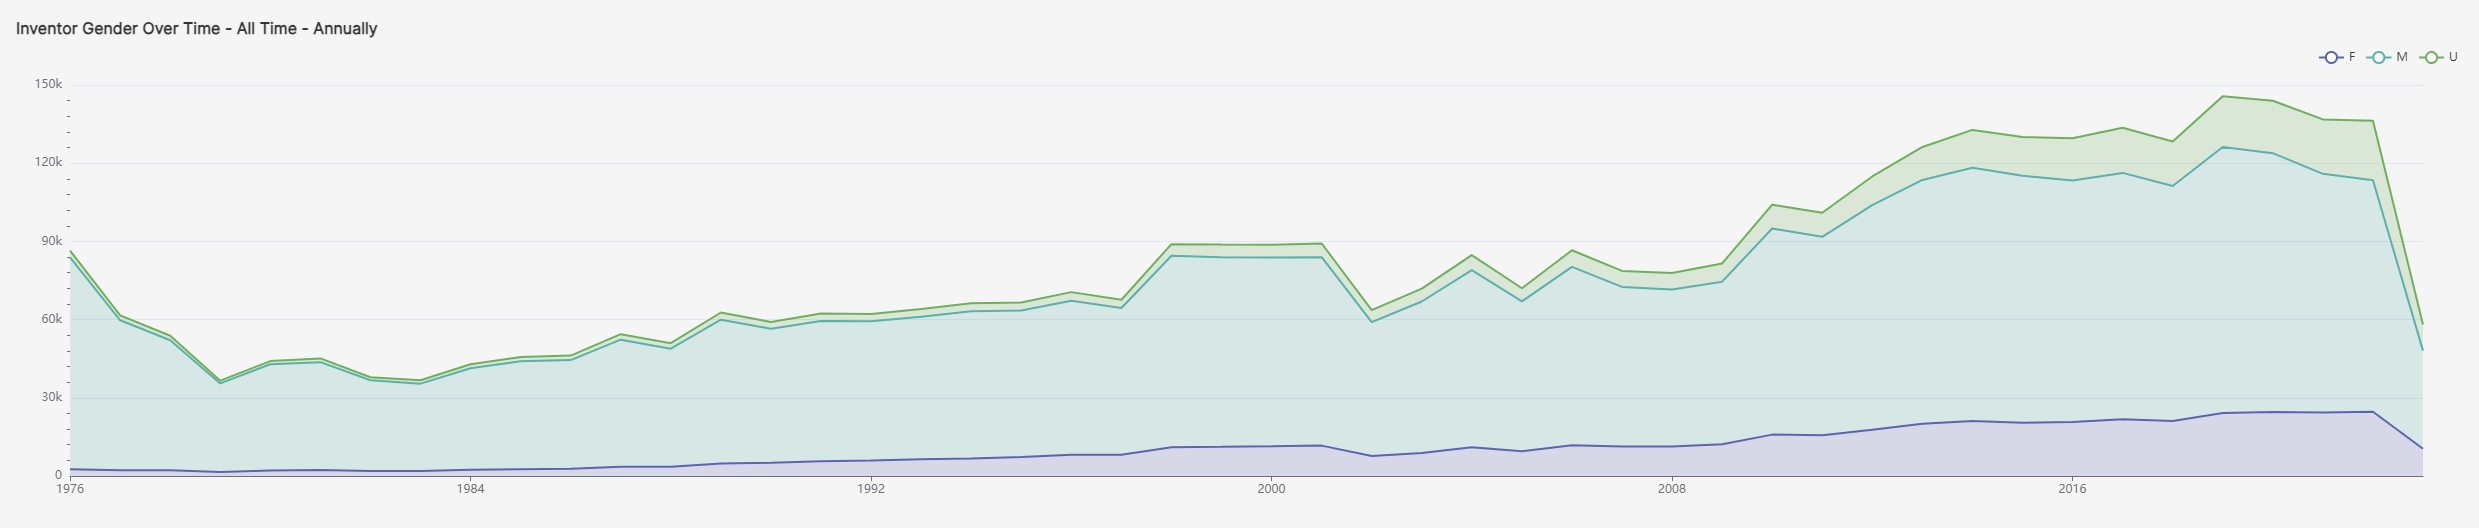
This trend is especially positive because it does not show a decrease in participation overall. In fact, the number of inventors of all genders has steadily increased over time, as shown in the graph below. Women and unidentified inventors have simply grown at a faster rate.
Room to grow
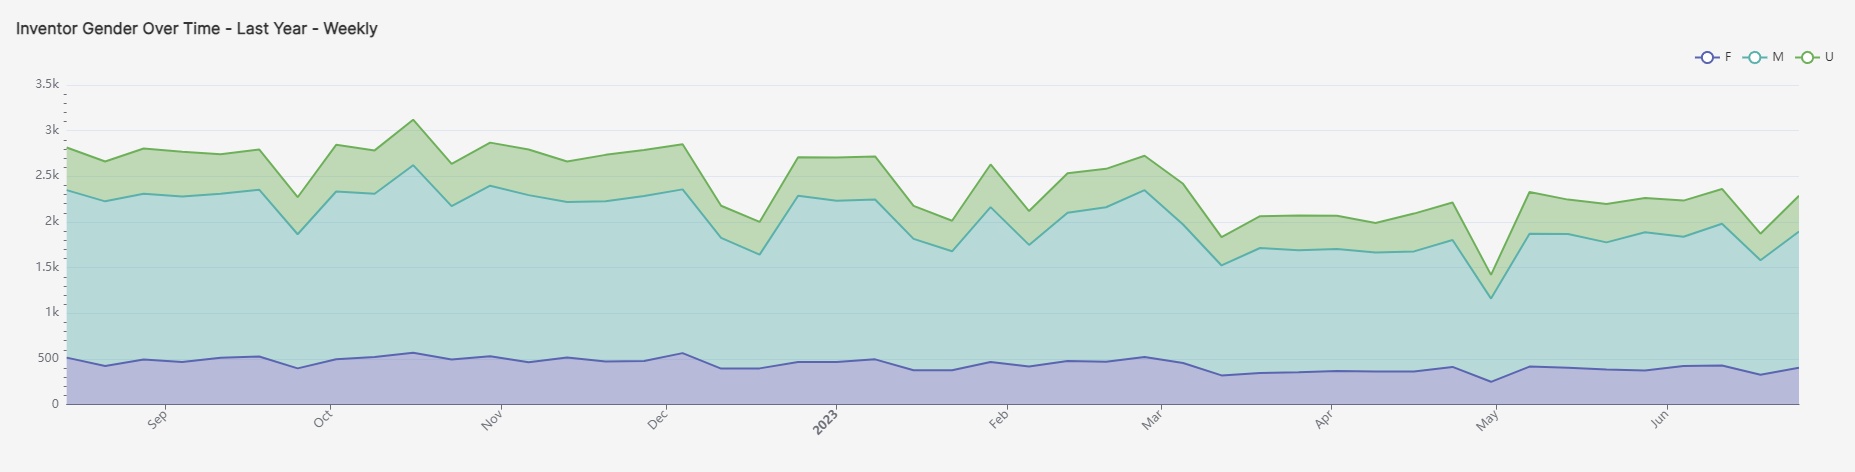
While these trends show positive growth in the gender diversity of inventors, the numbers are still heavily skewed male. Over the last year, men still made up the majority of inventors. Luckily, PatentsView can help policymakers and researchers explore these trends, and eventually find ways to ensure everyone can reach their full innovative potential.
This graph shows the total number of inventors who filed for patents over the last year, broken down by gender. The ratio of male to female inventors has remained stable through the year, with men still being the majority.
Explore more PatentsView data
PatentsView can help you discover relationships behind different patents, locations where patents have been granted, and other trends in innovation. Explore the data for yourself or visit our service desk to request an API key, provide feedback, and more.