 
 
 
IN THIS SECTION
ex. data visualization, research paper
  • Diffusion of Artificial Intelligence Technology

    Throughout recent decades, the role of artificial intelligence (AI) in the modern world and the lives of its inhabitants has increased drastically. From advancements in cybersecurity and military technologies to AI-driven greenhouses and algorithms that help health-care workers develop better treatments, AI has made its way into nearly every sector of society.

    The future of AI innovation and its influence on society will only continue to grow. It is with this in mind that the U.S. Patent and Trademark Office (USPTO), Office of the Chief Economist released a new report, titled Inventing AI: Tracing the diffusion of artificial intelligence with U.S. patents. This report details research conducted by USPTO in which a machine-learning AI algorithm was used to determine the volume, nature, and evolution of AI and its component technologies as contained in U.S. patents from 1976 through 2018.

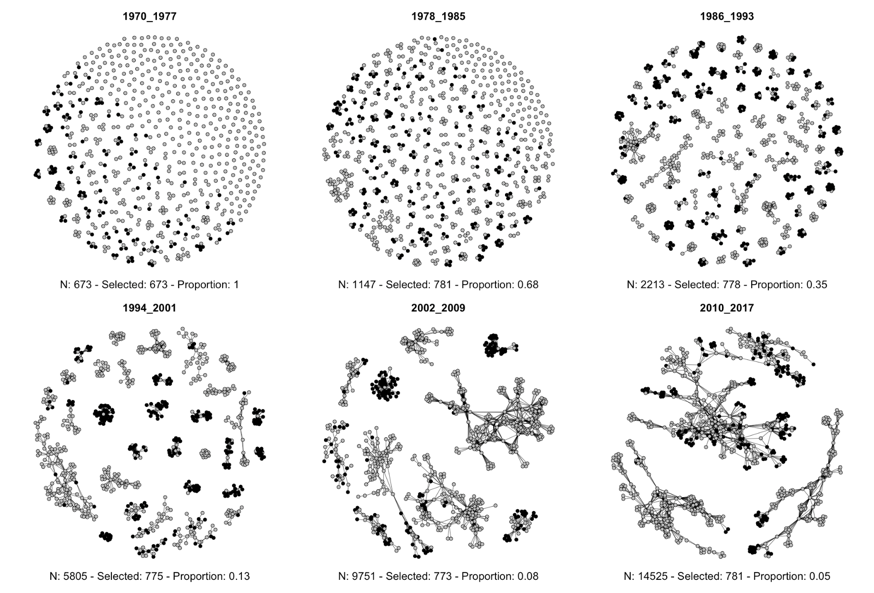
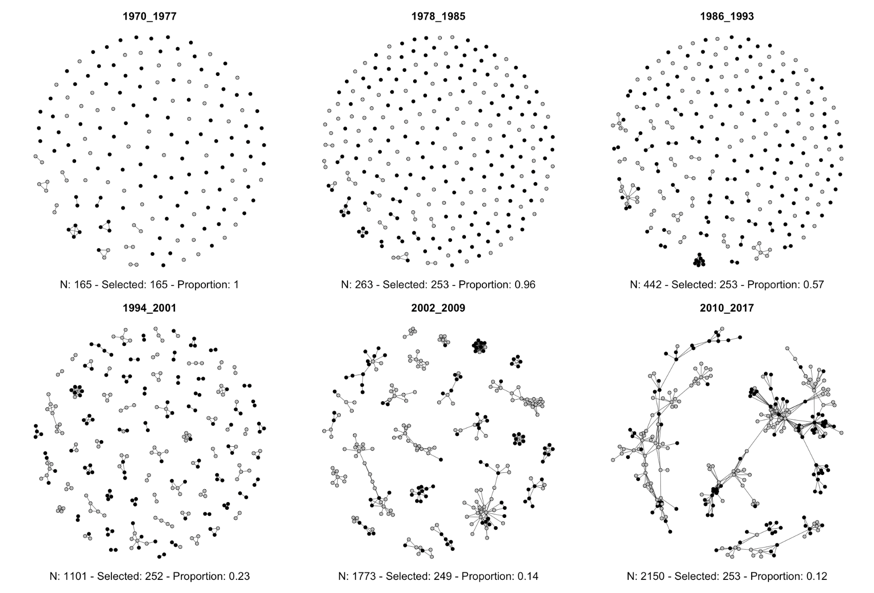
    A main goal of USPTO’s research was to measure the technology diffusion of AI with patent data. Technology diffusion is the process by which a technology is adopted by inventors, organizations, and other innovators as it spreads across different markets. In this report, USPTO details the methods it developed to identify the scope of such diffusion as it relates to AI and its component technologies.

    Patent data are extremely useful for such an analysis as they can give direct insight into the spread and adaptation of a technology or method. When a new, powerful innovation or technology such as AI is created, the speed at which it is adopted by inventors and organizations alike can partially be seen by the increase in patent applications filed and granted with reference to said technology. Figure 1 shows the growth of AI-related patents as a percentage of all U.S. patents by year. In the figure we can see a dramatic increase in AI patents, from less than 5% in 1980 to greater than 20% in 2018—a truly staggering growth in just under 40 years.

    Figure 1. U.S. Inventor and Owner of AI-Related Patents: Percentages From 1975 to 2020

    Figure 1. U.S. Inventor and Owner of AI-Related Patents: Percentages From 1975 to 2020

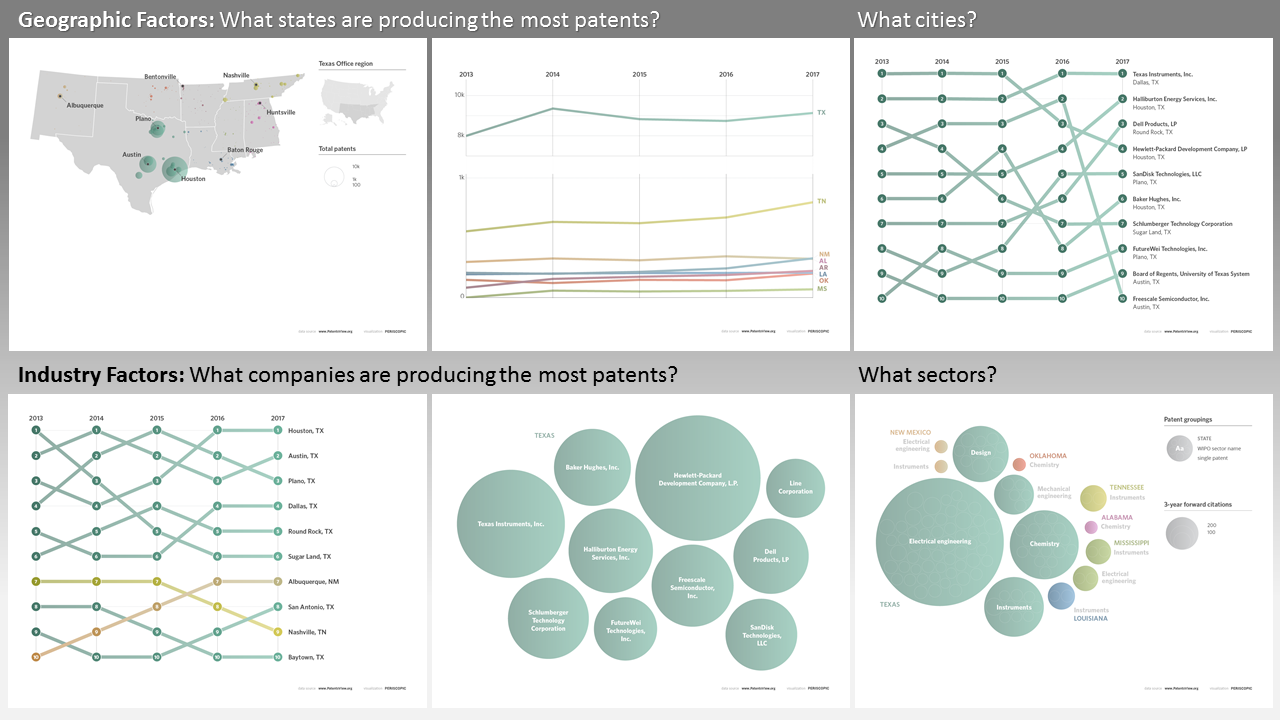
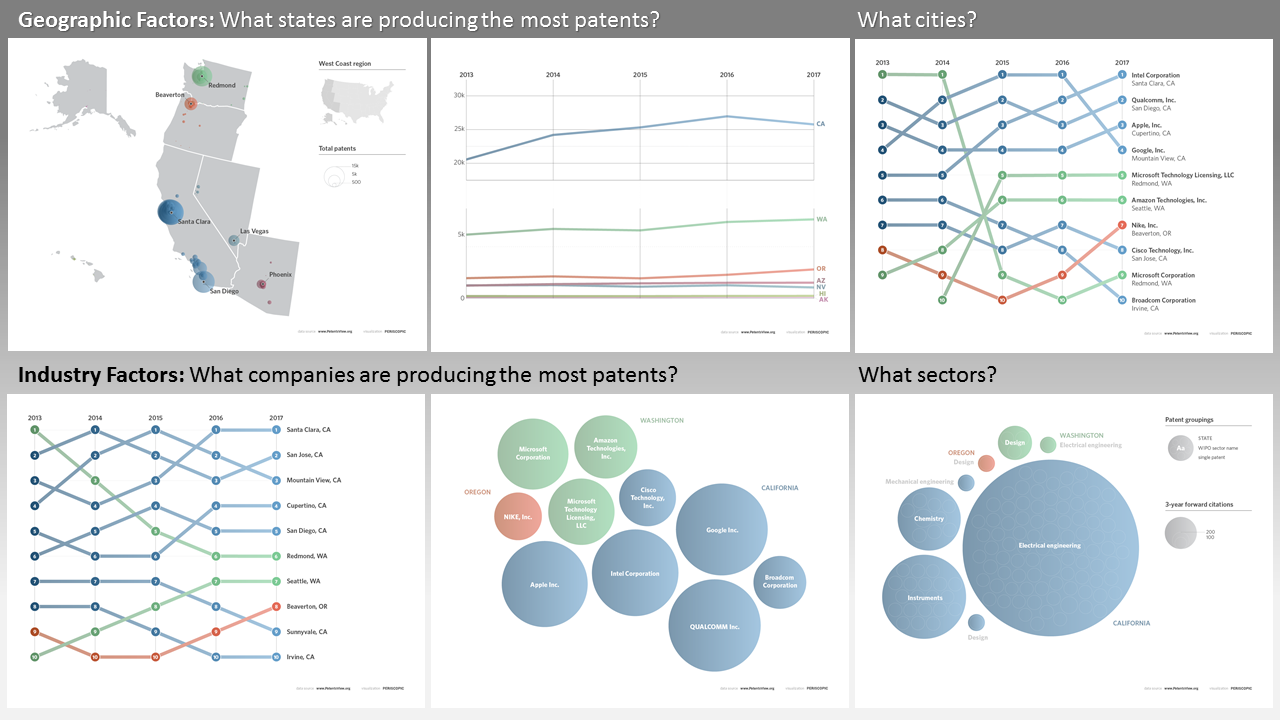
    In addition to the number of patents filed, patent data are useful in this research because each patent document contains detailed information and metadata. The person or organization that filed the patent, the technological classification of said patent, the location the patent was filed in, and so forth can all be found in one document.

    The role of AI moving forward will be determined by the willingness and ability of inventors to continue working with and innovating on the technologies of today. Although we cannot know for sure just how much of an impact AI will have on our future, research into the scope and diffusion of its technologies can give us a glimpse of what is to come.

    More information on the diffusion of AI as well as the AI method used to identify AI patents is available in the USPTO report.

  • Patenting in the Southern Region

    It is said “Everything is bigger in Texas,” and this is true regarding patenting as well. While patent production is concentrated in the areas around Houston, Austin and Dallas (see the map), innovation activity is spread across the entire Southern region. There are innovation hotspots in Albuquerque and Nashville, and a visible dispersion of patent activity throughout Oklahoma, Arkansas, Louisiana, Alabama and Tennessee.

    In terms of total patent production, however, Texas vastly leads its neighboring states, though there has been recent growth in the number of patents issued to firms in Tennessee. Within Texas, Houston leads with the most patents produced in recent years, followed by Austin and Plano.   

    The top 10 patent-producing entities in the Southern region are primarily in information technology and energy sectors.  Hewlett-Packard and Texas Instruments have some of the largest patent portfolios in the region, though key patent-producing energy companies include Halliburton, Schlumberger and Baker Hughes. The top patent producers also include the University of Texas system, showing the relative importance of academic-led research to the region.

    The number of forward citations a patent receives is indicative of its value and influence on future innovation. Highly cited patents (those having 100+ citations) are particularly impactful. Not surprisingly, the most influential patents originating from the Southern region concern technology in electrical engineering, chemistry and instruments. While Texas produces the most highly cited patents, Mississippi, Tennessee, Louisiana and New Mexico have all produced influential patents in electrical engineering or instruments. Likewise, Oklahoma and Alabama have generated some of the most-cited patents in Chemistry. 

    These observations are consistent with the region’s focus on driving innovation in information technology and energy.

    ____________________________________

    The U.S. Patent and Trademark Office’s (USPTO) Texas Regional Office is located in Dallas, Texas and serves Alabama, Arkansas, Louisiana, Mississippi, New Mexico, Oklahoma, Tennessee, and Texas.  Opened in 2015, the goal of the Texas Regional Office is to promote innovation and stimulate the economy by connecting inventors and entrepreneurs to government resources, supporting students and teachers through our STEM education programs, gathering feedback from regional stakeholders, and recruiting diverse talent from the region. For more information, see https://www.uspto.gov/about-us/uspto-locations/dallas-tx/dallas-texas.

    Data for this post was derived from the PatentsView website and database:  https://www.patentsview.org

  • Invention and Collaboration Networks in Latin America: Evidence from Patent Data

    Carlos Bianchi*, Pablo Galaso**, and Sergio Palomeque***

    Our research aims to analyze the collaboration networks associated with the processes of invention and patenting in Latin American countries between 1970 and 2017. We build and analyze three types of collaboration networks: networks of inventors, networks of innovators (i.e. patent owners) and networks of countries in the region. The study of the structural properties and the evolution of such networks allow us to present unprecedented empirical evidence on the forms of interaction and collaboration to invent in Latin America. This evidence shows that collaboration networks in Latin America are highly fragmented and disconnected. Moreover, networks are notoriously foreign-oriented, i.e. the linkages with external nodes are critical compared to the low presence of local connections. The contributions of this work are three-fold. First, it presents novel empirical findings with unique information on interaction patterns at the Latin American level. Second, it allows analyzing the whole region and the main trends in the light of the large research background on invention and development from this region. Finally, it discusses some stylized facts in national cases, with the aim of encouraging new research questions for further research agenda.

    Some relevant findings

    Network graphs provide us a first sight of the overall connectivity in co-invention (Figure 1) and co-innovation (Figure 2) networks. Both types of networks are very fragmented in separate components, especially in the case of innovation networks. This finding implies that, at the Latin American level, there is no single and cohesive system of actors interacting and collaborating to produce patents. The Latin American reality seems to be made of, rather, a constellation of separate groups of inventors and innovators that, either form independent teams, or collaborate with absolutely no one.

    Figure 1. Co-invention networks at the Latin American level
    Figure 1. Co-invention networks at the Latin American level

    Source: authors based on PatentsView data. Note: grey nodes are inventors located in Latin America, black nodes are inventors located outside Latin America. For the sake of clarity, we present only the best-connected sections of the networks, where the largest components are located. Below each graph, the following data is presented: the total number of nodes in the network (N), the number of nodes represented in the graph (Selected) and the proportion represented by the nodes plotted against the total number of nodes of the network.


    Figure 2. Co-innovation networks at the Latin American level
    Figure 2. Co-innovation networks at the Latin American level

    Source: authors based on PatentsView data. Note: grey nodes are innovators located in Latin America, black nodes are located outside Latin America. For the sake of clarity, we present only the best-connected sections of the networks, where the largest components are located. Below each graph, the following data is presented: the total number of nodes in the network (N), the number of nodes represented in the graph (Selected) and the proportion represented by the nodes plotted against the total number of nodes of the network.


    (*) Instituto de Economía, Universidad de la República, Uruguay, email: cbianchi@iecon.ccee.edu.uy

    (**) Instituto de Economía, Facultad de Ciencias Económicas y Administración, Universidad de la República, email: pgalaso@iecon.ccee.edu.uy. Principal investigator

    (***) Facultad de Ciencias Económicas y Administración, Universidad de la República, email: spalomeque@ccee.edu.uy [U1] 

    Download the full paper at: http://www.iecon.ccee.edu.uy/download.php?len=es&id=724&nbre=dt-04-20.pdf&ti=application/pdf&tc=Publicaciones


  • Patenting in the West Coast Region

    The West Coast is a hub of high technology, from information and computing technology to aerospace.  Silicon Valley, Southern California (San Diego to Los Angeles) and the Seattle metropolitan area dominate this region in terms of patent production.  As we see in the map, the area outside Portland, Oregon as well as Las Vegas and Phoenix are also hotbeds of innovation. Still, in terms of total patent production, California leads the region with Washington a distant second.

    Top patent producing organizations include not only the well-known Silicon Valley firms – Intel, Qualcomm, Apple, and Google – but also Amazon in Washington and Nike in Oregon. Two entities under the Microsoft corporate umbrella (Microsoft Technology Licensing and Microsoft Corporation) are also key producers of patented innovation in the region.

    The number of forward citations a patent receives is indicative of its value and influence on future innovation. Highly cited patents (those having 100+ citations) are particularly impactful. Patents in electrical engineering, instrument and chemistry from California lead the way in terms influence. The most influential patents originating from the West Coast region involve electrical engineering. California generates, by far, the most highly cited patents, including those for electrical engineering but also those related to instrument technology and chemistry. 

    These observations reinforce the West Coast’s reputation as a global leader in high tech innovation.

    ___________________________________________

    The U.S. Patent and Trademark Office’s (USPTO) Silicon Valley Regional Office is located in San Jose, California and serves Alaska, Arizona, California, Hawaii, Nevada, Oregon, and Washington. The goal of the Silicon Valley Regional Office is to promote innovation and stimulate the economy by connecting entrepreneurs to government resources, supporting students and teachers through our STEM education programs, gathering feedback from regional stakeholders, and recruiting diverse talent from the region. For more information, see https://www.uspto.gov/about-us/uspto-locations/silicon-valley-california.

    Data for this post was derived from the PatentsView website and database:  https://www.patentsview.org

  • Patenting in the Rocky Mountain Region

    The Rocky Mountain region, home to the Western frontier spirit, is no stranger to innovation.  As we see from the map, Boise leads the region for producing the most patents.  But we also see hotbeds of innovation surrounding Denver, Colorado – including Englewood, Fort Collins and Boulder – and Salt Lake City, Utah – including Provo and Orem. Overland Park, Kansas, home of Sprint’s corporate headquarters, and Omaha, Nebraska, are also regional centers of innovation.

    Although the city of Denver has fewer total patents than Boise, the state of Colorado leads the region with the most patents produced in recent years.  Utah has also seen a recent rise in patented innovation.

    Boise’s innovative prominence is led by Micron Technology, which ranks first among the top 10 patent-producing assignees in the Rocky Mountain region. Two entities under the Sprint Corporation (Sprint Communications and Sprint Spectrum) are also key producers of patented innovation. The prominence of information technology and telecommunications is evident among the top patenting firms, including EchoStar Technologies, Level 3 Communications and CenturyLink. The top patent producers also include the University of Utah, showing the relative importance of academic-led research to the region.

    The number of forward citations a patent receives is indicative of its value and influence on future innovation. Highly cited patents (those having 100+ citations) are particularly influential. Every state in the Rocky Mountain region has contributed some highly-cited patents across a diverse range of sectors. Despite lower overall patent production, Kansas generates a significant number of highly cited patents across diverse sectors, including in electrical engineering, instruments and mechanical engineering.  Similarly, Colorado is the source for some of the region’s most influential patents in electrical engineering, instruments and design.

    These observations indicate a strong level of valuable patenting activity in the Rocky Mountain region, spread across several states and a diverse range of technologies.

    _______________________________________

    The U.S. Patent and Trademark Office’s (USPTO) Rocky Mountain Regional Office is located in Denver, Colorado and serves Colorado, Idaho, Kansas, Montana, Nebraska, North Dakota, South Dakota, Utah, and Wyoming.  The goal of the Rocky Mountain Regional Office is to promote innovation and stimulate the economy by connecting entrepreneurs to government resources, supporting students and teachers through our STEM education programs, gathering feedback from regional stakeholders, and recruiting diverse talent from the region. For more information, see https://www.uspto.gov/about-us/uspto-locations/rocky-mountain-regional-office-colorado.

    Data for this post was derived from the PatentsView website and database:  https://www.patentsview.org


Button sidebar