IN THIS SECTION
ex. data visualization, research paper
  • Data-in-Action Spotlight: Can natural disasters affect innovation? Evidence from Hurricane Katrina

    As climate events and changes increase globally, how could this affect innovation and patenting of intellectual property? Luis Ballesteros of the Questrom School of Business at Boston University explored this question with his research on Hurricane Katrina published in late 2021.

    A different perspective

    While there are geographical studies of innovation and patents that focus on social features like how close a person is to human and material resources and institutions, Ballesteros is interested in a different perspective – what he calls, “exposure to large shocks.” Ballesteros used PatentsView’s disambiguated inventor and location data to write Can natural disasters affect innovation? Evidence from Hurricane Katrina. The publication describes the effects of natural disasters on patents and patenting.

    How Hurricane Katrina affected innovation

    Evidence suggests that large societal shocks produce lasting variations in human risk-aversion behaviors. Based on that evidence, Ballesteros proposes that Hurricane Katrina in the U.S. would have changed innovation outcomes.

    More specifically, Ballesteros and supporting literature suggest that after an immediate shock, affected counties have much more patenting activity and the quality of innovation increases compared to non-exposed counties. This correlation has been shown to persist for roughly 10 years after the initial shock.

    Methodology

    Ballesteros’ methods involved constructing a history of inventors between 1999 and 2015 that allowed him to follow the “Katrina effect” across geographies. The estimates he found imply that shock-affected people were not only more likely to patent, but became more skewed toward high-technology sectors.

    Ballesteros controlled for natural variation versus shock-related variance in several ways, which he illustrated in section four, Empirical Strategy, of the publication. In section three, Data, Ballesteros provides insights on the challenges and nuance of working with patent data, including the consideration for average processing time between application date and granting of a patent (which was reported as 23 months on average by USPTO in 2021) and how this relates to conducting longitudinal research with patent data.

    Read the full publication to learn more about Ballesteros’ methods and insights on working with patent and PatentsView data.

    How are you using PatentsView data?

    If you have used PatentsView data in your own research, organization, or classroom and would like to be highlighted in a Data-in-Action spotlight piece, please visit our service desk.


    Citation for Luis Ballesteros work: Ballesteros, Luis, Can natural disasters affect innovation? Evidence from Hurricane Katrina (December 13, 2021). Available at SSRN: https://ssrn.com/abstract=3980107 or http://dx.doi.org/10.2139/ssrn.3980107

  • What's New with PatentsView - March 2023

    March Updates

    This month, PatentsView released the third quarter of 2021 data complete with the new algorithm and data structure updates initiated last fall. The release notes web page holds detailed information on this release and historical releases.

    Also released this month are annualized gender data files with new documentation and an updated data dictionary from the Office of the Chief Economist (OCE) at the United States Patent and Trademark Office (USPTO). These datasets are designed for use in quick exploratory data analysis as well as read programmatically for more longitudinally focused data users. The annual files contain information from the assignee, inventor, location, application, and patent tables all in one place for a more comprehensive picture of patenting teams. In addition to pulling in variables from these separate PatentsView data tables, the datasets contain novel variables including the total number of inventors on a given patent, the total number of inventors listed on a given patent that were assigned a gender, the number of men inventors on each patent, the number of women inventors on each patent, and a flag for demonstrating whether inventor information is available for that patent.

    To read more about these data files and the inspiration for their generation, visit the Gender & Innovation page and navigate to the DATA section located under the interactive visualization of gender data from 2000 to 2020.

    Looking Ahead

    The next PatentsView data update is gearing up this March and will result in a double release of 2021 quarter four and 2022 quarter one data come early-summer. The team is working with OCE this spring to improve and optimize the assignee disambiguation and gender attribution algorithms. The anticipated result of this dive into algorithm repair and improvement is higher quality data. As always, please reach out to our team with data questions and suggestions. Your exploration of the data and reporting of discrepancies and errors helps support our team to return the highest quality data to the public.

    To receive regular updates on what the PatentsView team is working on in distributing patent data and reading about patenting literature, subscribe to our bi-monthly newsletter. Happy Spring!


  • Spotlight on Patricia Bath

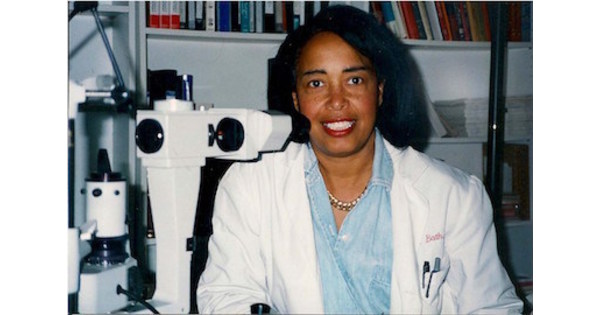
    In 1986, Patricia Bath filed for a medical patent for a novel method to remove eye cataracts. Bath was the first African American female physician to acquire a patent. Her patent has been referenced  over 100 times since its filing and has been cited as recently as February 2022 by Gregg Scheller and Matthew N. Zeid in their steerable laser probe patent.  

    The patent data alone will not tell you that Bath was the first African American female physician to acquire a patent. The race of inventors, like gender, is not part of any data collected by the USPTO and would require attribution algorithms similar to the gender attribution currently conducted by the PatentsView team.  

    Dr. Patricia Bath

    Dig Deeper into Patent Data 

    PatentsView provides an opportunity to look at women in innovation more broadly. With PatentsView’s bulk downloads data, you can now query the data to see counts and types of inventions by male and female inventors in the aggregate.  

    Last Fall, PatentsView hosted a symposium on the attribution of demographic information to inventors listed on patents with the USPTO’s Office of the Chief Economist. This symposium included updates on predicting gender and race using artificial intelligence and machine learning approaches, as well as insights on economic implications of these predictions to innovation policy.  

    These methods show how researchers can dig deeper into the data to reveal trends and opportunity gaps for inventors and entrepreneurs.  

    Looking Toward the Future 

    The breadth of PatentsView’s mission has evolved as the project matures. Beginning in 2012 with an endeavor to connect and show the work of unique inventors over time and place, the PatentsView project has expanded the scope of its connection and discernment efforts to the assignees, locations, attorneys, and gender of inventors involved in patenting the country’s latest innovations.  

    With the pursuit of disambiguation algorithms becoming more advanced in what they can identify from publicly available information on inventors and their patents, there is a need to consider the methods and implications for this line of inquiry.  

    For gender attribution, the algorithm assigns the likelihood of the inventor being “male” based on the person’s name and their location in the world. The other options for the inventor are “not male,” aka female in this dichotomous view of gender, and “unassignable,” meaning that the algorithm was not able to confidently assign male or not-male to the inventor.  

    A similar method could be applied to the likelihood of an inventor being of a certain race, nationality, or ethnicity. There are a variety of algorithms available using numerous different methodologies and each has unique advantages and disadvantages in terms of accuracy, expense, and time.  

    What do you think about the future of race attribution in innovation? Tell us in the forum. 

  • American Institutes for Research examines innovation in renewable energy patent study

    Social science research starts with a commitment to using our time and resources in addressing problems most affecting society and the human experience. One urgent and globally important area of social science research is renewable energy, specifically, understanding the rate of innovation and adoption in the sector.

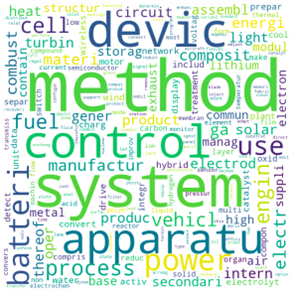
    At the American Institutes for Research (AIR), we have a team of data scientists that work on transforming, disambiguating, normalizing, and quality assuring all data on the patents granted in the United States. This unleashes opportunity for us to use the data in research and analysis. We chose to develop classification models that predict which patents are related to renewable energy and present our findings at the Conference for Women in Data Science and Statistics this year on 10/8/2022 in St. Louis, MI. We used the Cooperative Patent Classification (CPC) labeling system to find renewable energy patents and look at the most common words used in patent abstracts and titles for this type of patent, demonstrated in the word cloud below.

    Figure 1. Word Cloud of most popular stems of words  found in patent titles and abstracts.
    Figure 1. Word Cloud of most popular stems of words  found in patent titles and abstracts.


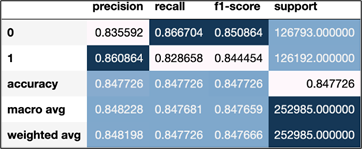
    We built random forest, logistic regression, and naïve bayes machine-learning classification models on the granted Renewable Energy (RE) patents (CPC subclasses under Y02) to predict whether a given patent was RE-related or not. Our efforts focused on searching for the model construction method and parameter choices that optimized the F1-score for Class 1 (predicted as RE-related). Our best-performing model was a random forest classifier and a CountVectorizer (a program to break down sentences into countable parts) on patent abstracts to achieve an F1-score of almost .85 as shown in figure 2.

    Figure 2. Results of random forest classifier and CountVectorizer methods on RE identification in patent abstracts
    Figure 2. Results of random forest classifier and CountVectorizer methods on RE identification in patent abstracts


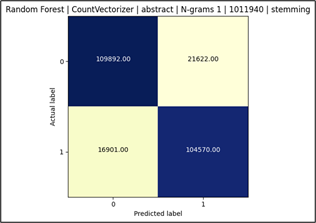
    Figure 3 is the confusion matrix for the model described in Fig 2. This matrix shows where correct/incorrect predictions occur. For example, 21,622 patents were predicted to be RE but were not given the Y02 CPC classification.

    Figure 3. Confusion matrix for the random forest classification algorithm
    Figure 3. Confusion matrix for the random forest classification algorithm


    Enabled by the PatentsView project developed at AIR under the supervision of the Office of the Chief Economist at the USPTO, patent data usage is paramount to holding the federal government accountable for investing and encouraging innovation in science and technology in the areas important to scientists and the public. While challenges to increased domestic and international adoption of solar, wind, and other innovations are interwoven and interdisciplinary, the rate of innovation in renewable energy sector is an important component to analyze and understand as we push to transition away from fossil-fueled power.


  • What's New with PatentsView - December 2022

    What’s new with PatentsView: Our Algorithm is getting better!

    Over the last few months, PatentsView has been improving its disambiguation algorithms. These improvements give researchers, students, inventors, intellectual property enthusiasts, and anyone else with an interest in patent information more accurate data to work with.

    What has changed?

    Our algorithms have been updated to better represent patent trends by location and assignee. The updated algorithms increase accuracy in clustering — the grouping of raw information into similar organizations — and incorporate Open Street Mapping as an additional source. This results in better, more accurate data and analysis.

    These changes apply to all PatentsView data, including bulk downloads, legacy and PatentSearch APIs, query builder tool, and list searches.  

    What are disambiguation algorithms?

    PatentsView’s data visualizations and analysis rely on a series of algorithms and post-processing techniques to sort inventors and assignees by name and place. We need this process, known as disambiguation, because patent data is often incomplete or inconclusive.

    For instance, the U.S. Patent and Trademark Office does not collect data on an inventor’s gender. So, PatentsView uses an algorithm to make an educated guess about gender based on an inventor’s name and location.

    In other cases, one inventor may apply for multiple patents using different variations on their name, like John Smith, J. Smith, and Johnny P. Smith. Our algorithms help determine if these are all the same inventor or three different inventors.

    Why is this important?

    Innovations and inventions benefit all of society, and that benefit is increased when every inventor can fully participate in the process. Accurate analysis of patent data helps identify gaps, and thus provides a first step toward closing those gaps.

    PatentsView’s goal is to provide the most accurate, up-to-date, and complete analysis of intellectual property data to foster better knowledge of the IP system and drive new insights into invention and innovation. Updates like this put us one step closer to that goal.

    You can learn more about our methods and sources at https://patentsview.org.

Button sidebar